Linux from Novice to Professional Part 1 - System Level.
Today morning I received a message from LPI that my certificate will expire in 9 months and so it is time to start studying for the second Linux certification, this will advance me to the third Linux information security certification that I will search for, this certification is divided into two and the two parts are marked by two different codes: 201-450, 202-450
In this post I am going to go over each topic as listed on the LPI website, which means I will go over each tool and present it here, in each chapter I will show how to use these tools to get the same information that the subject of the test should deal with, at the end of each chapter I will present a challenge From most of the commands we learned and challenged you and me how to get the information to succeed.
If you want a brochure that deals with the topic extensively regardless of this post I recommend the booklet by Snow B.V. Her name: The LPIC-2 Exam Prep 6th edition, for version 4.5. This booklet helps me a lot and I recommend going through it at the same time, and yet I will try to elaborate as much as possible in the post here to be ready for the test.
Objective 201-450
Chapter 0
Topic 200: Capacity Planning
Before we start I think is good to memorize way we here to learn linux, just think about world without linux, the power that linux give us and the world is limit less, we can take that technologist and use it to bring new ideas and invention to the world. So at the start I think it is good to take a look of some comedy short video that I found.
In this chapter, we need to address computer hardware issues and how to use Linux to make sure that, such as system resources and resources, it is important to know these concepts because these tools can help us deal with the resource utilization problem, and we may run software only after a long time Since running it, or it is possible that only a certain program after a certain operation will consume all the resources on the computer, in this case we want to know how to look at the resources and check which component utilizes it.
In this way we can know which program is the problematic and which program causes the computer to work slowly and even freeze. Most of the tools we present here are tools that show you how to see what your computer’s CPU is used for, what software is currently working, how many free memory we have, and a few other things to help us understand how the Linux operating system works.
stress
In our case we can start some virtual machine to get ready and learn the commands, but how can we demonstrate some memory issues or CPU’s problems? in that case we can use stress, that command can load up our memory and CPU’s to 100 percentage which can be handy if we want to view such issue with the command that supposed to help us find the program that cause to that issue.
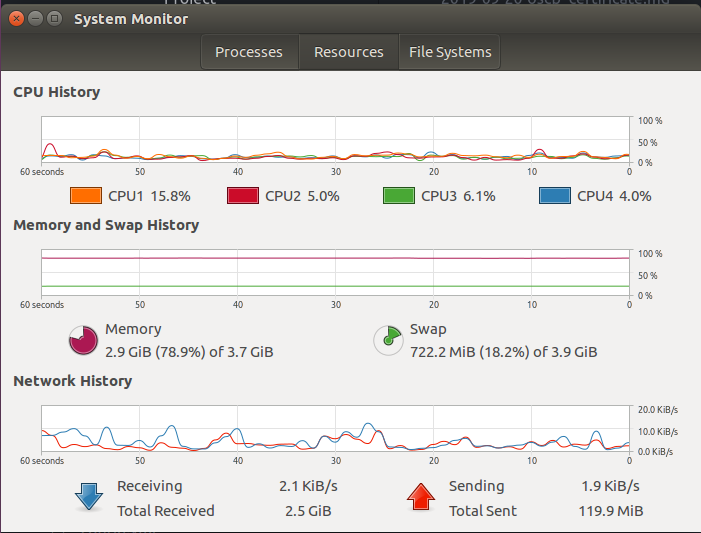
I am use Ubuntu, and like on other system operation, I have system monitor that can help me to view my processes on my linux machine, if some program take more CPU than others I may feel like I have sort of slowness in my computer, so, using the system monitor can be handy to find what is the problem in my case.
If some program utilizes the CPU overly you will see it on system monitor, on the resource the grap will jump up and on processes tab you can find what program utilizes how much from you CPU or memory, let’s run the following command.
1
stress -c 1
This command will dispatching the hug lol! it utilizes one core of your CPU, in my case I have 4 CPU, so one of them will be loaded and I can see it on my system monitor resource tab.
 Figure 2 System Monitor, one CPU are loaded over.
If I check out my processes list I will find that the stress program are running and utilizes at least 25% of my all CPU.
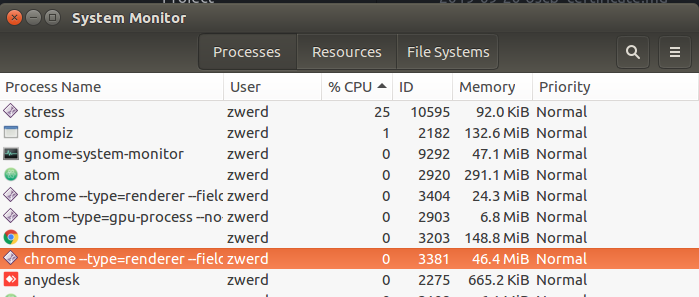 Figure 3 Stress program utilizes.
You can also run stress to utilizes the RAM, in that case you specify how much chunk you want to use, every chunk are 256mb, in my case I have 4 giga memory to use so to load it up I can run 15 chunk which is 3840 megabyte in total.
You can see all of my C^ keys because I freak out, my computer was freezing and I can’t do anything but the ctrl+C command, so now after it done I run 6 chunk that will not going to crash my system but at least I will be able to view the RAM used.
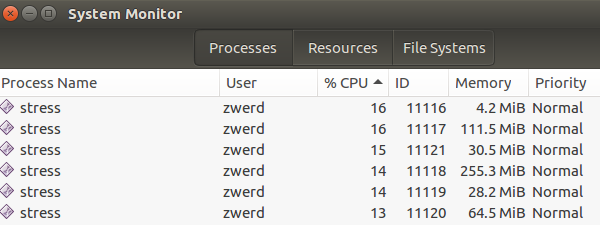 Figure 5 Stress the RAM again.
You also can see on the resources that my memory really over load and my RAM is over 55% used and also my swap is over 59%, please remember that the swap is your virtual memory that run on your hard disk, which mean in my case on the hard disk I have 4 giga memory that been used as swap, if you see such of thing this is not normal and maybe the system are loaded, becouse as default the swap memory will never been use unless the regular memory are over and that the swap get to use.
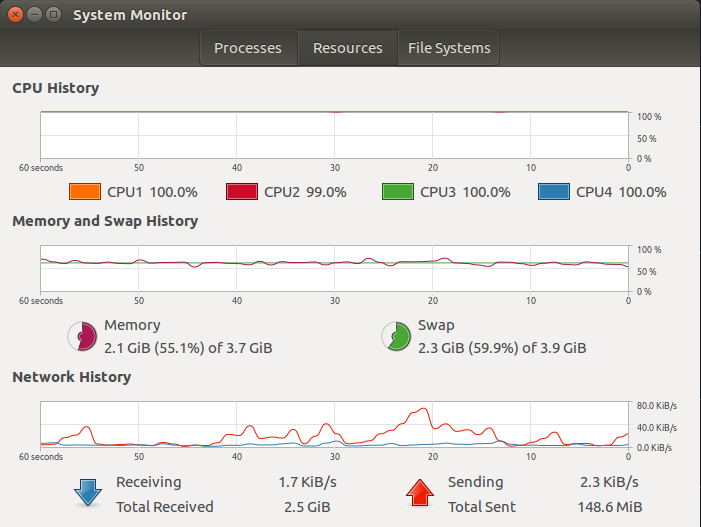 Figure 6 Stress the RAM, in resources.
You can also use stress to load the system by using that hard drive, just type the following command, that command can affect the io which is the input/output wait and called i/o block, this is a processes queue, if for some reason one process can’t run because the CPU are over loaded, that process will wait on until the CPU can handle it, the worst thing about that is that this process is on uninterruptable sleep mode which mean that you can’t even killed it.
1
stress --hdd 1
But let’s say that you are working at company X, and there you have some linux server without GUI, so in that case you may what to be familiar with the command that can help you to find the problem via terminal.
Top
That command can give us the same as the system monitor, you can view the percentage of CPU, RAM and more in the top table, so let’s look at that.
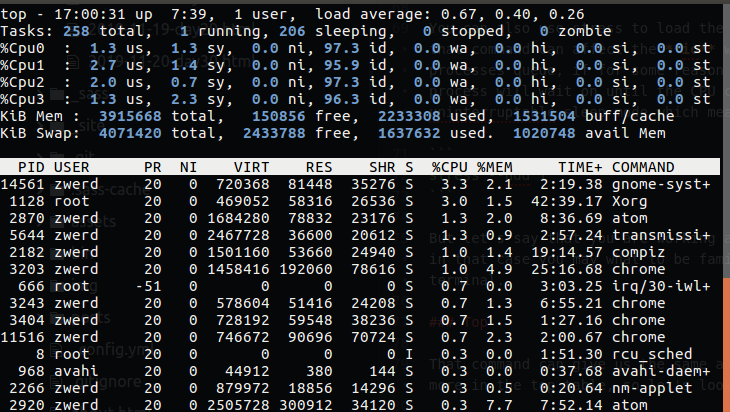
By typing the top commend, as you can see, it bring me table that refresh every 3 second by default, you can change that value by using the top -d 5 command for 5 second, or inside the top screen press d and it will ask you to setup new interval for screen update.
 Figure 8 Change interval with d.
You also can see the CPU in percentage, if you have 1 CPU that mean using full of that will be 100% and you will see this number on the cpu in the top command, if you have 4 CPU than if one of them are on the 100% utilizes, than in CPU field you will see 25%. You can also view every CPU separately by press 1 on your keyboard.
 Figure 9 Display every one of my CPU.
The information for every field over the CPU are as follow:
us: user cpu time (or) % CPU time spent in user space
sy: system cpu time (or) % CPU time spent in kernel space
ni: user nice cpu time (or) % CPU time spent on low priority processes
id: idle cpu time (or) % CPU time spent idle
wa: io wait cpu time (or) % CPU time spent in wait (on disk)
hi: hardware irq (or) % CPU time spent servicing/handling hardware interrupts
si: software irq (or) % CPU time spent servicing/handling software interrupts
st: steal time - - % CPU time in involuntary wait by virtual cpu while hypervisor is servicing another processor (or) % CPU time stolen from a virtual machine
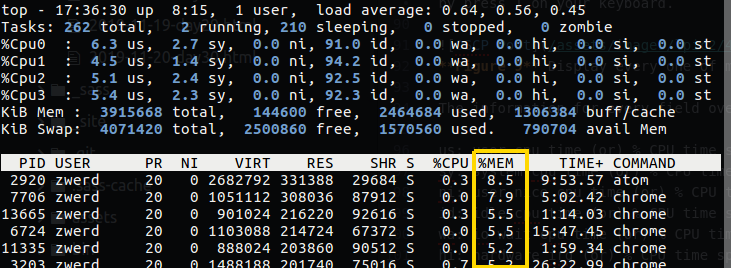
By default the CPU tab are sort, which mean that you can see what program take more CPU than others, if you want to change this sort and resort it by memory, you can press on shift+> that will sort the right column which is the RAM.
If I will run stress now for check the cpu on the top, my cpu can cam up to 100% only if I type the command as follow:
1
stress -c 4
You can see that my CPU is nearly a hundred percent, so this is mean that if I done stress -c 1 it only load just one CPU core. The same will be in the case of memory as we saw earlier.
If I will load my hard drive which mean in our case to use stress --hdd 1 command, this can change the value of i/o wait time, on the top you can find it under wa field.
 Figure 12 Wait time are loaded.
Again, this case mean that we have process that use the hard drive and there is a program that on wait state that in sleep mode that we can’t kill.
Please nore: this top command bring us more details that can be handy, as example we can know every command, which is more likely will be service name or process name, what is the CPU and memory that this program will use, also we know the username who run that service and also the PID for every process, if some process is over load we can kill it by typing kill -9 <PID number>.
vmstat
In that command we can view the memory that being used and CPU values, i/o and system utilizes, if you type this command you will get that information but that’s it, not like top that refresh itself every 3 second by default, but you can run it with refresh like, by using delay and count option. In the delay you specify how long to wait between every time it display you the information, the count is how many time it will repeat it self, in that case you can see the changes along the way.
1
vmstat 3 5
In that case this command display report every 3 seconds and repeat that five times, as you can see on the output I have, the free memory change every 3 second and so in the cpu and i/o.
 Figure 12 vmstat, 3 seconds delay, 5 count.
You can view also only the disk i/o that display the read and write statistics by using -d option or memory statistics by using -s option. The following is the way to view the table in wide mode, it’s display more readable table which can help understand more.
1
vmstat -w
You can combain the option as follow:
1
vmstat -w 3 5
I have being seeing people that use that command in their program to track the operation of the memory and CPU, in the case of issue with the resources we have, you can find more useful commands than that.
In the man page I found the following information that related to the field in that output:
Procs
r: The number of processes waiting for run time.
b: The number of processes in uninterruptible sleep.
Memory
swpd: the amount of virtual memory used.
free: the amount of idle memory.
buff: the amount of memory used as buffers.
cache: the amount of memory used as cache.
inact: the amount of inactive memory. (-a option)
active: the amount of active memory. (-a option)
Swap
si: Amount of memory swapped in from disk (/s).
so: Amount of memory swapped to disk (/s).
IO
bi: Blocks received from a block device (blocks/s).
bo: Blocks sent to a block device (blocks/s).
System
in: The number of interrupts per second, including the clock.
cs: The number of context switches per second.
CPU
These are percentages of total CPU time.
us: Time spent running non-kernel code. (user time, including nice time)
sy: Time spent running kernel code. (system time)
id: Time spent idle. Prior to Linux 2.5.41, this includes IO-wait time.
wa: Time spent waiting for IO. Prior to Linux 2.5.41, included in idle.
st: Time stolen from a virtual machine. Prior to Linux 2.6.11, unknown.
free
In that command you can more easily understand your free memory that using mvstat in my opinion, because it allow you to view that memory by using megabyte instead of kilobyte that requires you to calculate these values.
1
free -m
In my case I have 3823 MB memory in my computer, the memory that are used is 1999 MB and free memory is 124 MB, the shared memory in my case are 208MB, this is mean that there is a two or more process that can access that common memory, the buff/cache are the memory that in the buffer or cache, the consept of that is that if you used some program and close it, that memory going to cache, if you will open that program again, the memory are cached in, so it can bring up the program more quickly. However, if you need this memory, it will allow you to use the memory and get of the cache. In my case the memory that as being cached are 1699MB, available does include free column + a part of buff/cache which can be reused for current needs immediately.
1
free -h
You can also use the -h option which stand for human, it can help you more clearly to view the amount of memory that are used or free.
You can also use count which can help display the output several times like in the vmstat, but we haven’t delay option, the delay will be 1 second.
The swap memory shouldn’t been used, because as we saw earlier that memory should be available only for case we have no memory to use in our system. In my case the SWAP are use more then 300MB, which is not so good, because as I said that need to be normally in value of 0. In Ubuntu the default value of the swap that can being used although we have free space in the memory is 60% of the swap in total, we can view our swap value in by using the command cat /proc/sys/vm/swappiness, in order to change that value we can use the following command:
1
sudo sysctl vm.swappiness=10
Please note that in the case of sysctl, the changing of swap is temporary value, which mean after reboot the value will go back to the last value, to make sure this value be permanent we need to change the vm.swappiness on the /etc/sysctl.conf file. The recommended value for the swap is 10% as much as I know, but you can experiment it.
I use the following command for look on my memory changing:
1
stress -m 6
In that case you can see that swap are really working hard and the cache was release a bit, this is mean that my system going buggy behavior, and now we need to find what causes this issue.
iostat
According to man page, the iostat report Central Processing Unit (CPU) statistics and input/output statistics for devices and partitions. The iostat is a part of the sysstat package which mean that this packets contain several other tools and one of them is iostat, in my case I use Ubuntu, but if you are using some other operation system that doesn’t have that tool, just install it on you distribution, if it’s Debian like, you can use apt-get, if it is Fedora like, you can use yam, in my case to install the sysstat package I run the following:
1
sudo apt install sysstat
By running the iostat we can find information about our i/o on our system.
The ouput contain the linux kernel version, which is Linux 4.15.0-66-generic and my PC name which is zwerd. You can also see the date (although for just date we use date command). we also can see the type of our operation system which is 64 bit in my case, and that I have 4 CPU available. avr-cpu display the CPU for every of the following
%user - The CPU that used at the user or application level.
%nice - Every process consume the CPU, for every process there is a priority that can be use to decide who is more important and who is not, if you have up to 10 process on the backgound and they want to use CPU, the high-priority process will get consume the CPU before other, in that case the nice value will be negative which mean high-priority for that process.
%system - show the percentage of CPU utilization the been use by the kernel.
%iowait - stand for input/output wait, this is show the percentage of time that the CPU or CPUs were idle during which the system had an outstanding disk I/O request.
%steal - Show the percentage of time spent in involuntary wait by the virtual CPU or CPUs while the hypervisor was servicing another virtual processor.
%idle - Show the percentage of time that the CPU or CPUs were idle and the system did not have an outstanding disk I/O request.
Let’s load up my system to see the changes on our output, I use the command stress --hdd 1, if we use top command we will see the wa load up, which mean that we have many process that in wait time state and they wait for CPU that can process them.
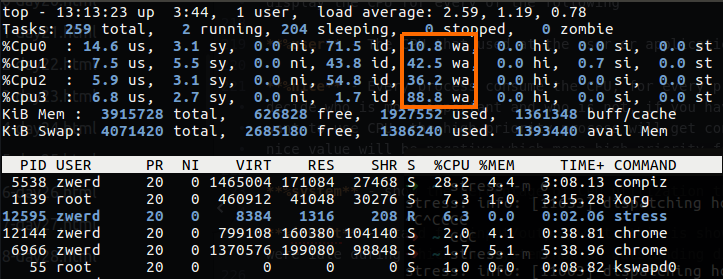 Figure 19 I/O wa by using top command.
We can use -x for extended information that include utilization as well, we also can print out the output as that same way we done on vmstat, it can display output multiple time and delay from each as follow:
1
iostat -x 3 5
In that case it will print out every 3 second, 5 times.
 Figure 20 iostat with extended.
After I load up my hard disk by using stress, this what I got on the iostat output, you can see that the values on the output load a lot.
If you have more than one partition, you can use the option -p, this option displays statistics for block devices and all their partitions that are used by the system, you can also display it only for one partition by specify that partifion.
1
iostat -x -p sdb
 Figure 22 iostat for specific partition.
sar
If you want to see the iowait like we saw on iostat but in the form of a display like in TOP command, you can use sar command. This command print out the current status of the nice, system, iostat and others, you can use it to see on real time the status of your system activity.
In my case I use sar to display state every second for 5 times, as I already write above, sar is part of sysstat, so if you have some issue to run it, you need to check that it’s enable on the file /etc/default/sysstat:
1
2
3
4
5
6
7
8
9
#!/bin/bash
# Default settings for /etc/init.d/sysstat, /etc/cron.d/sysstat
# and /etc/cron.daily/sysstat files
#

# Should sadc collect system activity informations? Valid values
# are "true" and "false". Please do not put other values, they
# will be overwritten by debconf!
ENABLED="true"
You can run the command sar -r 1 5, the -r option stand for report memory utilization statistics, on the output you can find the KBCOMMIT and %COMMIT which are the overall memory used including RAM.
You can also run sar -S which will give us information about the SWAP free and used memory.
Please note: sar is actually collect, report, or save system activity information and it can be any information activity regarding our system, as example we can use sar -b which will bring us report I/O and transfer rate statistics, one of them is the tps which is the total number of transfers per second that were issued to physical devices.
iotop
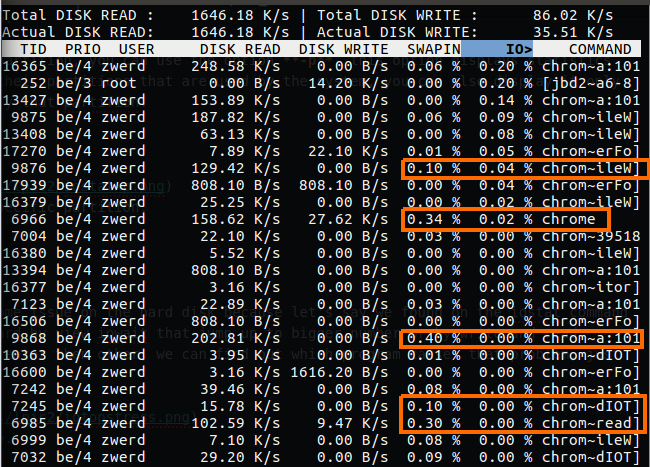
If we found that we have some issue on the hard disk because let’s say we found on the iostat command that the i/o work really hard by view iowait that jump up to bigger number or by write and read values from the disk are greater then other, we can find out which program causes that problem, just type iotop.
In my case you can see that it tell us that the most utilizes program in the IO of my hard disk is stress, you also can see that it specify the hdd by side of that, which tell us what option has being used in stress command.
In the iotop you can also see the swapin value, and in my case as you saw earlier, my swap are really utilizes by some program, so I checked it out and find what is the program that used my swap.
lsof
This command list open files on your system, which mean you will see all files that are use under your username, so if you run that command it is not very useful, but I tell you what, if you feel like you have some memory issue of hard disk working hard and you check and find what program are running, you can run lsof and grep the program you suspect that make you the issue, and then you can see exactly what files are open with that related to this program.
Let’s run stress command for utilizes the hard disk and see if we can find the stress files.
 Figure 27 lsof stress files that are in use.
As you can see the binary file are in use, if you see that your computer are leak of speed because of some program and you want to check what files are used by that program, the lsof can be the solution for you.
uptime
This tool can tell you the how long the system has been running, also you can find out how much users connect to this PC and what is the load average, the load average first number represent the load time average for 1 minute, the second is for 5 minutes and the last one is for 15 minutes.
You can view the exec time in nice mode that can be display.
w
This command show who is logged on and what they are doing, you also can use the who command, but this command can be handy in the network cases, let’s say that some one connect to your computer or server remotly, you can use this w command for checking out what is the source ip of that user.
1
w -fi
The -f option stand for from filed that will be specify on the output, the -i display on that line the ip address rather the
You can see that I have two connection that one of them have IP address, I made this connection from other PC to my local computer, the first line specified my local user. You also can see that the remote user use zsh program remotely, if I change it to bash on my other PC I will see that on the w output
 Figure 31 Using bash instead of zsh.
netstat
This tool can help us to find out on the network level processes that using the network, and many connection that are open between your computer and the local network. But first of all it is important to know how we can look at the network level using netstat.
1
netstat -ie
This command will show us our local network interface with his IP address and MAC address which is the physical address of that interface.
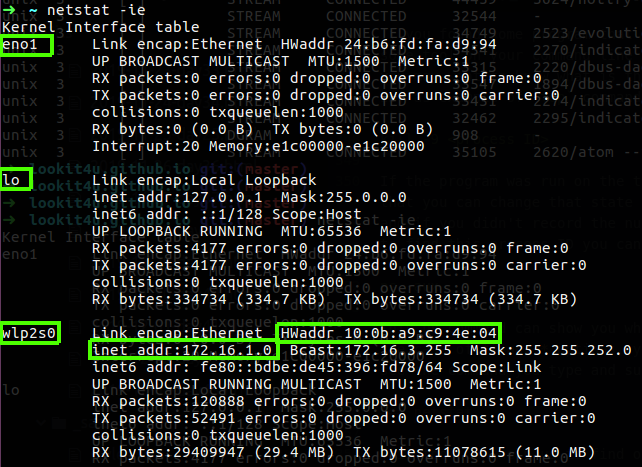 Figure 32 My interfaces network.
It is the same as ifconfig, you can also see the TX and RX which stand for transfer and receive of the bytes over that interface, the eno1 is my physical interface while my lo is the loopback, the interface I used right now is wlp2s0 which is my WIFI interface, you can see that the TX and RX on that interface are pretty high, you can grep that by using the “bytes”
We also can use netstat to get the statistics of our network interfaces, in that case we will see the count of IP pakets that go though our network interface, we can see the icmp packets that are used for PING traffic and also there is the TCP and UDP packets the go through out interfaces. If we see an error in one of the statistics under specific protocol/field we will know that something on our network are stoping us to get that streem of packets.
1
netstat -s
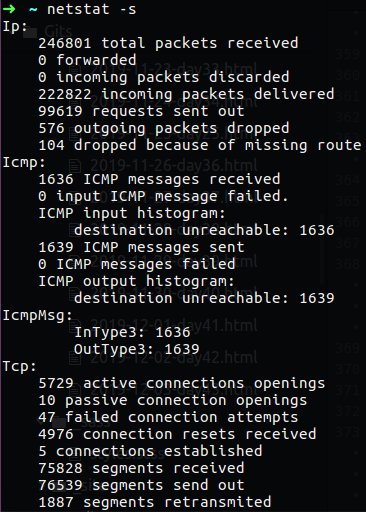 Figure 33 Statistics by using netstat.
You can also use netstat -tuna, the -t stand for TCP connection only while -u stand for udp, the -n will show the numericla address instead of trying to find the hostname, -a stand for show both listening and non-listening sockets, so by running this command we can see the connection that are running over the network and their address
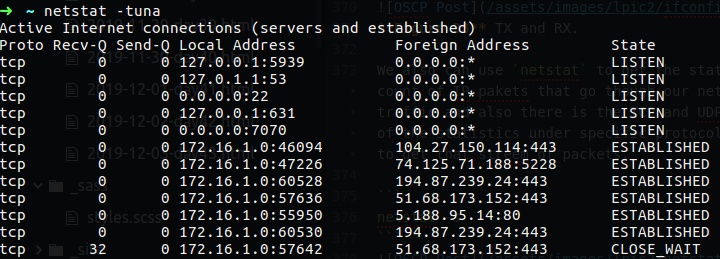 Figure 34 Statistics by using netstat.
The command I love to use is netstat -nepa that can show you the program who use the connection and their process ID number which can be handy to find some process that use the connection and stop it by that ID number.
 Figure 35 Process ID of networking connection.
TIP
If you found some program that make some issues on your commputer, let’s say that you run some script or some tool on your command line or you have some program on the GUI and you want to kill it, in that case you may want to know what is the ID number of that process, after you find out what is the process number ID, as example of top command, you can kill it by using the following:
1
kill -9 <process ID>
If the program was run on the terminal and you type ctrl+z that it is on suspended state, this is mean that you can change that state and load it again or just kill it. For killing it you need the proccess ID, and if you didn’t record the number ID you can’t find that process on the top because is on suspended, so to find this process ID you can type the follow:
1
ps -aux
This ps command can show you what is the process ID that are suspended and after that you can kill it. in the case of -aux options, you will see all the process that run under your user, you also be able to see the command you type and suspended under the COMMAND column.
If you want to view in more visualize mode you can use pstree, this command display tree of process, that’s mean that you can more quickly understand how is the parent and child of process. if you use pstree -a you will see the agrument of the program or command that are run on your system. If you want to see specific process on the list you can type the pstree -H <PID>, in that way the all tree print out on the screen but every process that related to chrome will be highlighted.
 Figure 35 Chrome process ID using pstree.
If you wnat to see just that process without all the tree we can use pstree -s <PID>.
In the network cases process you can also use very handy command that can bring you more relevant information, as example let’s say that we want to see the bandwidth and the statistics of the utilization of that bandwidth with connection information like source and destination address, well for that case we can use iftop command that can bring us information in real time about the traffic that go through out network interface, you can see by using that command the amount of bandwidth that are utilize by which host that have connection to our local computer.
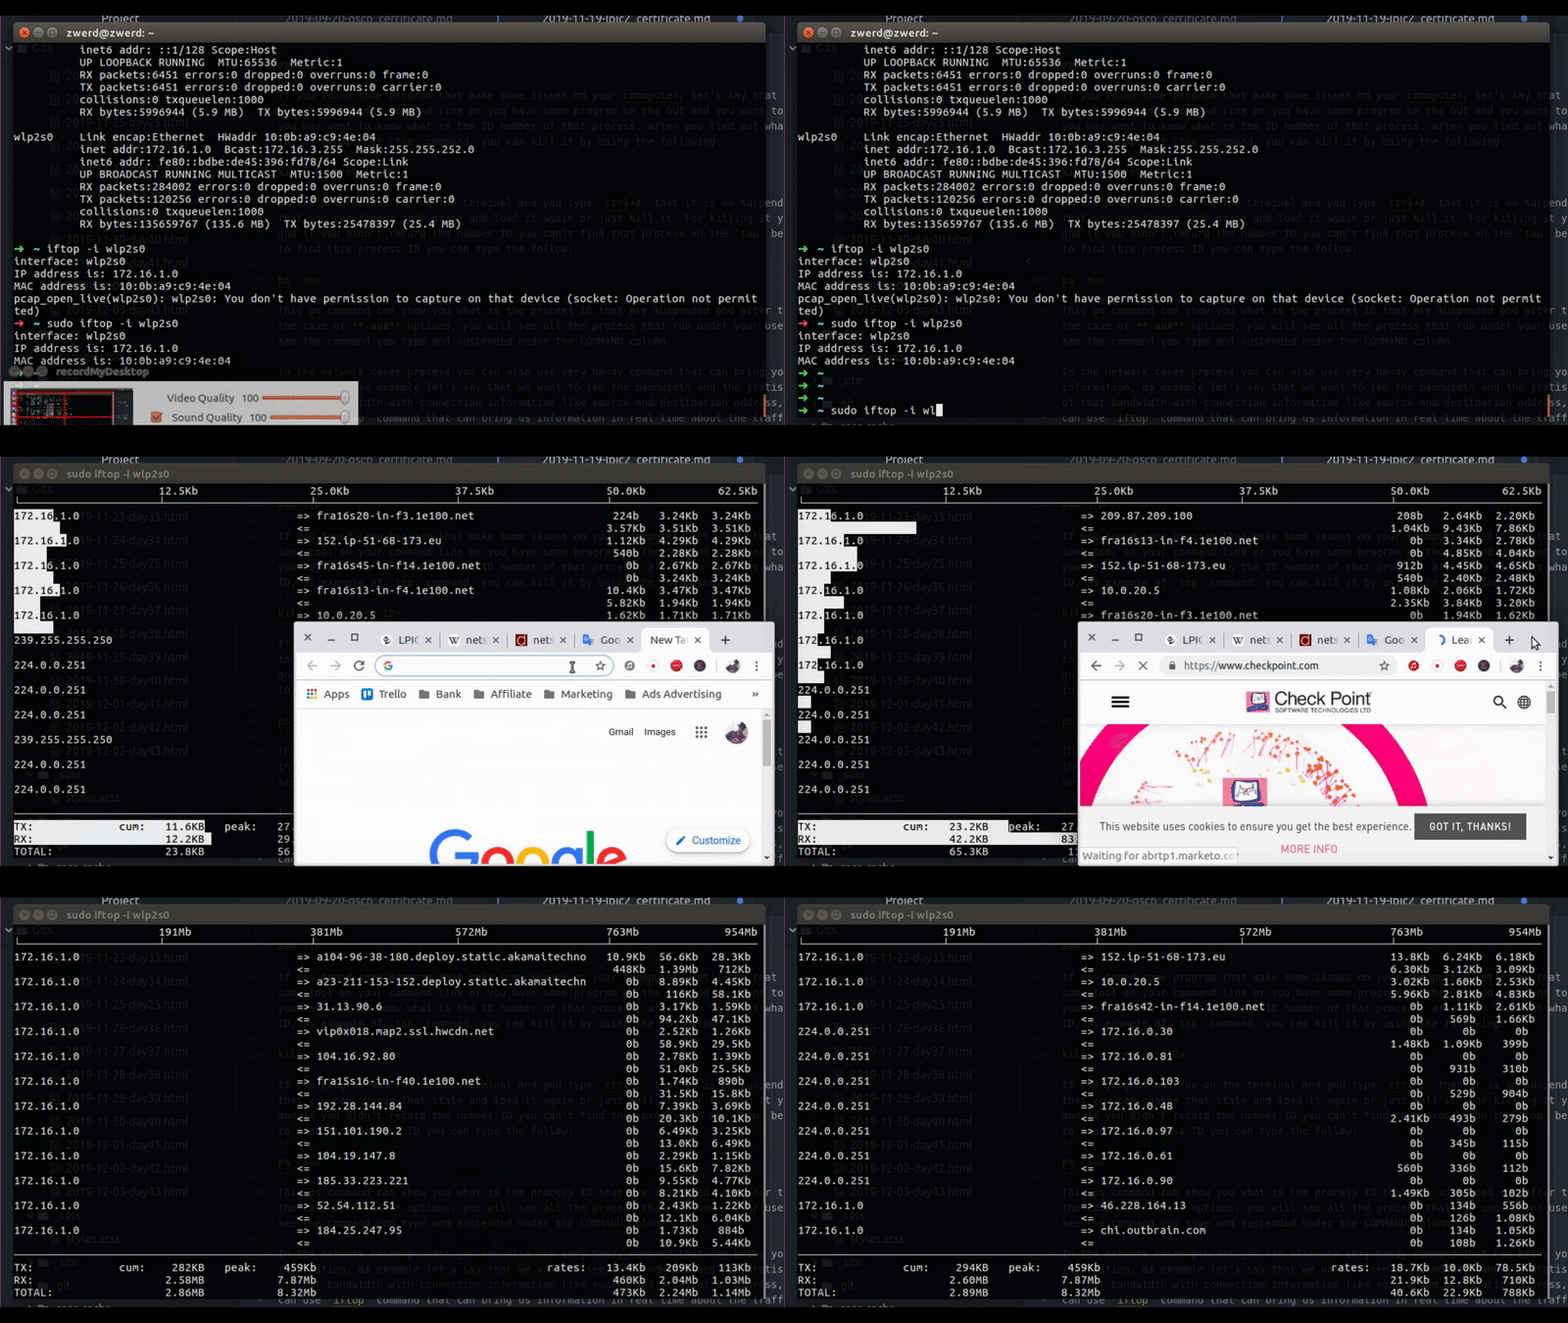 Figure 36 bandwidth of connection in real time.
You can to see in real time the traffic that I have on my wlp2s0 interface. The bigest connection trafic will be on the top of the list and that can give you a clue if you have some program that take advantage of all your bandwidth you can see which is the destination address and go back to the netstat to check what is the process that run this connection.
Another handy tool you can use is nload, this tool are monitor your bandwidth load, which mean you can see if you have a lot of traffic going on the incoming side or outgoing of you interface, in my case I connect to Mint Linux site to download some iso file that you can see my graph changing on the nload command.
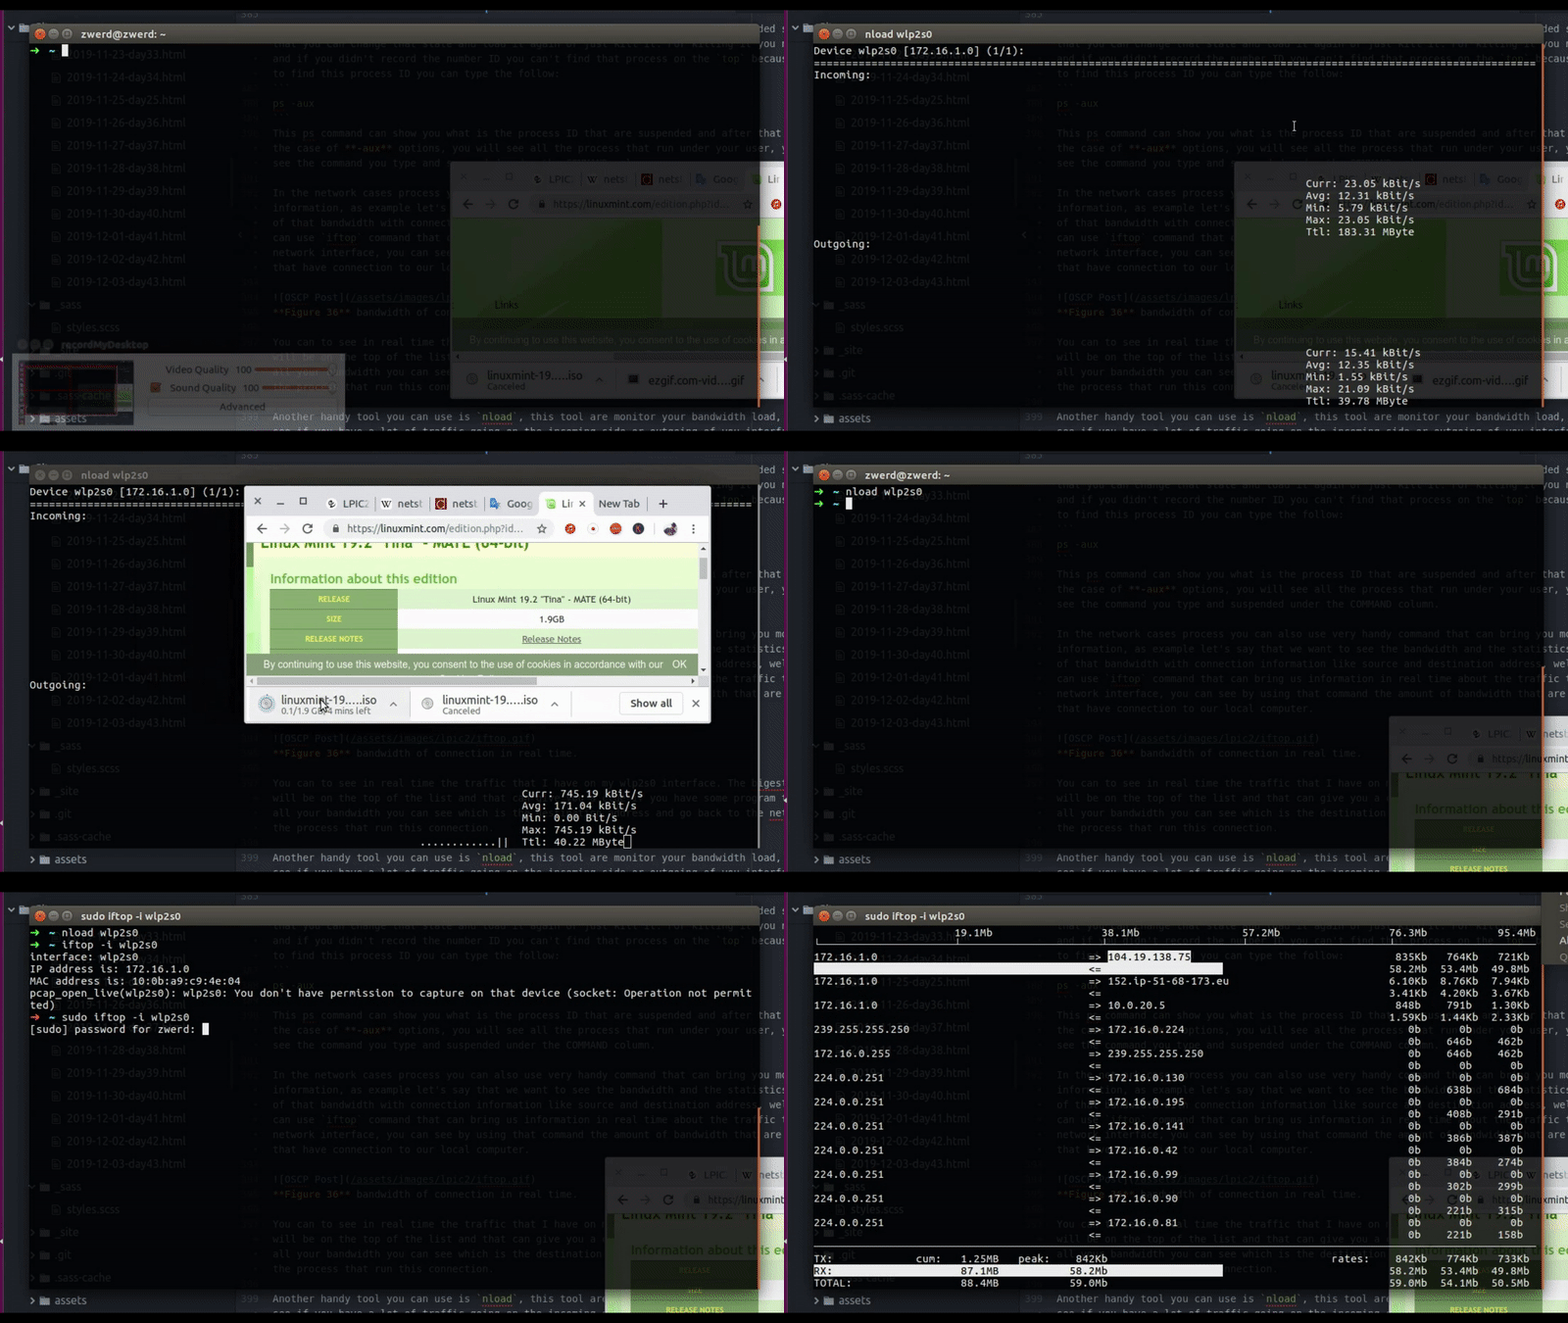 Figure 37 Using nload and iftop to see the download traffic.
The graph load up and on the iftop we can see the address that have a connection to my computer which I download the iso file from it.
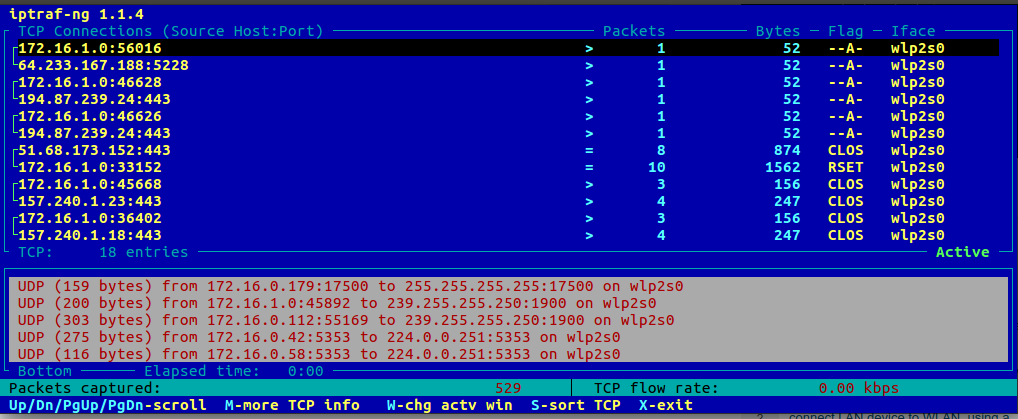
You can also use iptraf or iptraf-ng these tools allow you to see the connectiviry of TCP connection that came to your computer.
Network Monitoring
Let’s say you work at the IT position on some organization and you got some call from the support team that tell you they have some client that his computer work slowly in every action over the network or internet, in that case you will need to check and troubleshoot that issue, you need to find out if the slowness appear when the client side over the internet or on his local network, to do so we have many tools that can help us in these cases.
One of that tools are the iperf, this command can check the bandwidth between two point over the network, this is mean that we can use it to check if the local network have the slowness issue or not, the other tool you can use is speed test, you can find one on online website that can check the bandwidth between you and the internet, in that case you will be able to see if the slowness are appear over the internet.
Let’s start with speed test that I found speedtest.net, you just need to click the button and this site will give you the details.
In the case of iperf we have two mode, server mode and client mode, it dosn’t matter were you run each mode, what is matter is what is the bandwidth between them, on the client side we need to run iperf -c <server address>, on the server side we just need the command iperf -s, after we run it the detail about the bandwidth between the server and client will reveal.
You can see that in my case the bandwidth from my computer to another in my lab is 2.57GB which is good for me, in the case of our example that you have client that complain about slow network, you may have to check several thing, the first one is to check his and other computer connectivity out of the local network with speed test, after that you will go to the second check which is bandwidth test between two local computer. If on the first test using the speed test, let’s say you found that the client computer work slow by speed test and other computer aren’t, then you run the second test which is the iperf and found low bandwidth connectivity between the two, in that case it’s mean that we have local network problem that can be found on the local network interface or the nearly network device like switch or router.
On the LPI site under 200.2 object you can found that they want the student will have awareness of monitoring solutions such as Icinga2, Nagios, collectd, MRTG and Cacti, well these programs can be install on you computer or other server and you can monitor the resource you have, but the Cacti is monitor program for network connectivity and so the collectd, so I don’t really understand way they want to have a knowledge of these program, in the day day life I don’t think I am going to use such program to monitor my network resource, but in the case of these program, all of them work in the browser, this is mean that you have some URL and you can view the bandwidth or interfaces status etc.
Please note: after all we see here I want to specify something that I solve on many situation I had in the companies I worked for. Let’s say that you have some web server that have some content of data for many users, so far you after you read all of that chapter you have the knowledge to use Linux tool for checking the performance, memory used, network bandwidth and etc. If for some reason you see that the RAM used was increase every months and in percentage that grow up, in that case you may consider to upgrade the hardware for that server like adding more RAM memory or install more web application server and distribute the load between them, so in such case we will check carefully what is going on our server in the hardware used, we can monitor that and track down the performance with the tools I specify above.
Challenge 200-1
- create some large file that contain more that 100MB.
- Transfer that file from other computer in your lab by using
nccommand. - Check and view the transformation and bandwidth utilization.
- Check the CPU and RAM used during the transformation and find the PID.
This is simple challenge but it can help us to rule the commands we learn so far, I know that there is a new command in that challenge like nc, but it you going to linux field you need to have a clue how to solve issue and problems alone by searching the solution and be comfortable with new commands on cli.
1. Create file of 100MB
To create large file I used the fallocate, this command can create for you file in any size you will need, in my case it was very useful.
1
fallocate -l 100M megafile.pno
This is not really matter what extension for that file you will create, what is matter is that file are in the size we want which is 100 MegaByte.
2. Transfer the file you have to other computer in the LAB.
I created that file on my Kali linux so I tryied to transfer it back to my Ubuntu, on my Ubuntu I set up the netcat to play as server with the following command
1
nc -vlp 1007 > megabyte.png
On the client which going to be my Kali linux, I run the following command:
1
nc -v 172.16.1.0 1007 < megabyte.png
Please note that in my segment the subnet contain more than 254 address which is classless of 23 as prefix, also note the redirection, on the client side I redirect the megabyte.txt file to the connection that I am going to have with netcat, on the server side I redirect the output from netcat to the megabyte.txt which will going to be the same as on my Kali.
 Figure 42 Netcat on my Ubuntu, the address is of my Kali.
3. Check bandwidth and utilization.
Wile the file are transfer I run on my Ubuntu the command we saw earlier to view the utilization of the bandwidth on the network interface, the first one was nload command that will give us the information in a half of second what go through in your interface.
I can see that there is a tranformation or more likely data that go through my interface network, but I can see the connection it self, that go in and out through my interface, in that case I needed to use iftop which can tell us each connection what is the source address and the destination.
You can see the address 172.16.1.0 which is my computer, the Kali has the 172.16.0.251 address, so now we know that there is connection between us and other machine and we know that data are transfer in this connection.
4. Find the PID of the utilize program.
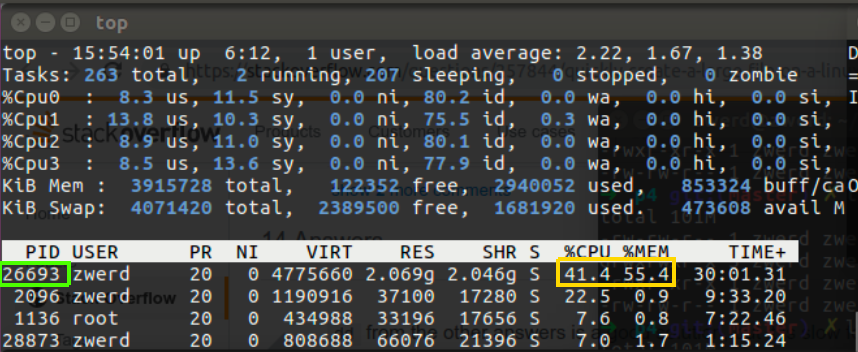
Now let’s say that we want to check the state of our system, like checking the CPU and RAM that used, I run the top command and found some process that showed up on the top of my list, so this is the process that I want to look at it.
You can see that I have the PID, so now we want to find and check the state of disk IO, because remember, if there is utilize of the CPU and RUN, something like that can be a program that run on our disk, in my case I know that some program are running on my Ubuntu, so I run iotop command which can tell me what was done on the disk.
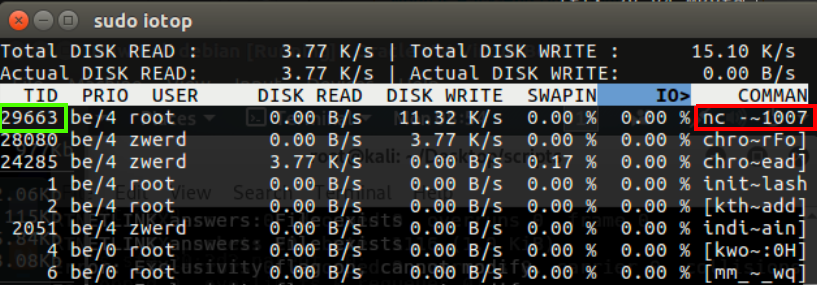
Now you can see by filter the PID we found earlier and found the program that run on our PC, in my case it’s nc program and it’s also showed me part the nc command which contain the port 1007.
Summery: it is important to know how to read and found information of some program in our linux operation system to deal with utilization issues or network problem, the PID can be your best friend to address the issue out but it’s important to know that if we decided to kill process, this action may not be the best solution for that issue, because maybe that problem will appear back again tomorrow, the best solution can be found on the dip level of that issue, we just need to understand why that issue appear and for what it depends, after we found that we may have the ultimate solution that can migrate that issue for best.
Chapter 1
Topic 201: Linux Kernel
When we talk about linux kernel we want to be able to find out what is our linux kernel version and how to read that version, which mean how we know if that version is stable or be familiar with more details that this version number contain.
First of all let’s check our version number, we can done that by using the uname -a command, this command will print out the version number and the name of our machine also time and date and even what is our computer architecture, which is 64bit in my case.
 Figure 47 My linux kernel core.
The first number is the version number, in my case it is kernel version 4, the next number is the major revision which in my case is 15 and the third number is the minor revision number, the fourth number is the patch level.
In the past, in the version of the kernel was a general rule in the number version, in the second number every odd number was as developed version, and the even number was as stable version, as example the 1.5.2 kernel was under development and version 1.6.2 was known as stable kernel version, when the kernel version 2.6.x came along it stay for long time without numerate the number except the last one number, because version 2.6.x was so awesome! so the third number and even the fourth number which stand for the patch number was the only numbers that numerate long the way.
One more thing that you need to know is that after they release the version 2.6, they get ride of the odd/even number and every new release is stable and not under development, every stable version will develop and update on a new version.
When the version of that kernel raise up and was 2.6.39.4 than Linus Torvalds decided update the enumerating to be more like the old one, which is the first number will be major release, the second will be minor release and the third will be the minor revision which is stable or patch to update abilities on the kernel. You may sometime see like a fourth number which play as a patch, in my case of 72-generic this is the Ubuntu specific patch they done.
You can find the versions of kernels that you have in your Linux machine under the /lib/modules folder and in each one we can found every modules that are run on our system.
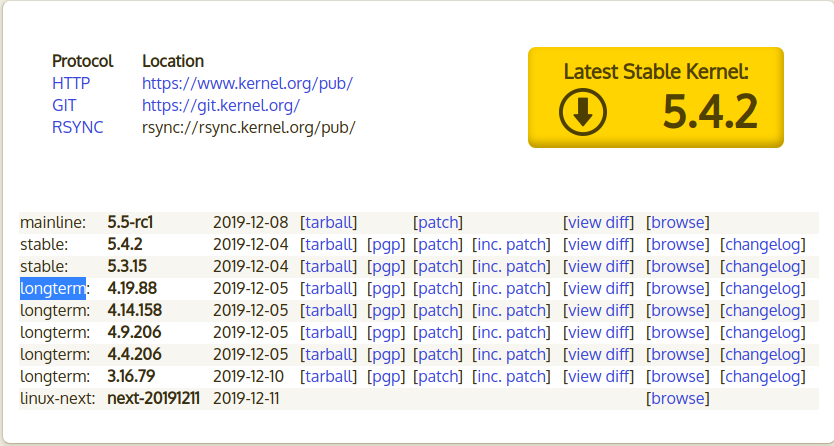
We can go to the kernel archive and found there the kernel that are stable and under operation release use. The meaning of longterm is that this kernel version will be available for long time because one of the operation system like Ubuntu or centOS or Red Hat may maintain and using this kernel version, this is why you may be seeing some old kernel version in that site.
If we going to the kernel folder under the kernels version that I showed up earlier, we will see that every module lies on the most appropriate folder.
In the net folder we will find every module that related to the network card and such, in the fs folder we may found thing that related to the file system, if you want to see every module that are enable on your system, you can just type lsmod.
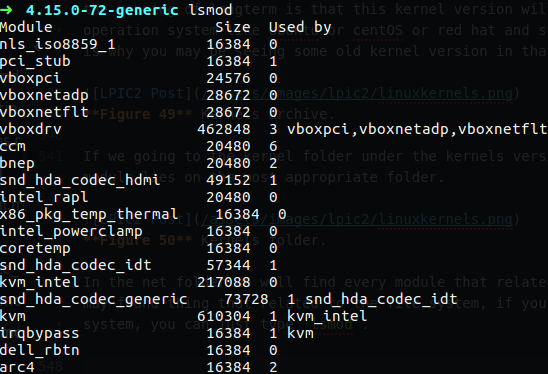 Figure 51 lsmod to see the modules.
As you can see the modules that are enable print out on my screen with lsmod, you can see the module name and it’s size, you can also see what modules are depends on which of the modules as example the vboxdrv module is the module that responsible for the vbox on my PC I guess, and there is three modules that relay and depend on that one which are vboxpci, vboxnetadp and vboxnetflt.
You can remove module by using rmmod you just need to know what is the module name, as example, let’s say that we want the floppy out, so we can grep it by using lsmod.
 Figure 52 Find out the floppy by
 lsmod.
Now, in order to pop it out we need to use rmmod with the name of that module.
 Figure 53 Remove the floppy module.
If we want the module back in, we need to use insmod, but for insert back from the dead some lost module we need to let him know the exact path for it. we can use find for finding that module.
 Figure 54 Finding the path for floppy module.
We now can use this path to insert that module back in. You can see that now I can find that floppy module in the active module list of lsmod
 Figure 55 Inserting the floppy.
There is another way to remove module from the active list by using modprobe, in this command we can remove module and insert it back without specified the full path.
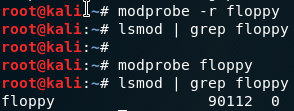 Figure 56 Modprobe for remove and adding module.
The command modprobe know what is the path of every module by using the modules.dep file, this file contain every module information and dependencies, to update this file we can use depmod -a that will go and insert the information of the modules to this file.
important thing you may want to know is that module that have dependencies can’t be remove out because it in use, in that case we will need to remove the modules that are use this module.
 Figure 57 Remove module, error because it in used.
We can get more information about the module by using modeinfo, by using this commend we can found the path for that module, dependencies, version and more parameters that module have, so, in case we want some module use specific parameter, we will remove that module and use modprobe to insert it with the relevant parameter.
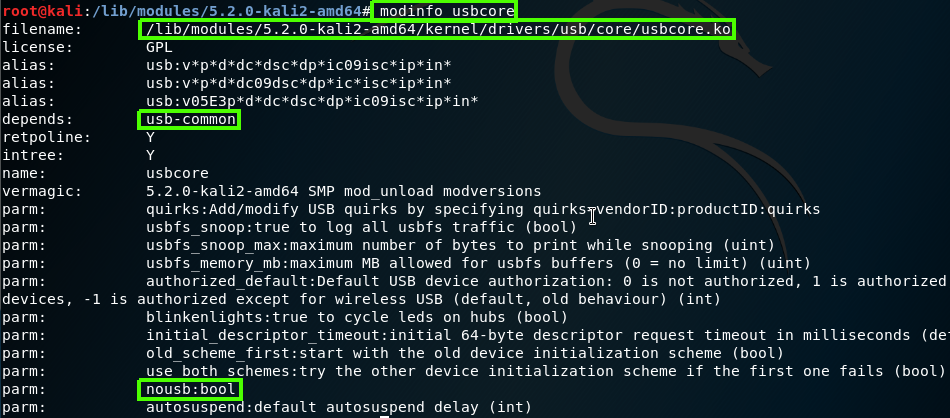 Figure 58 Module info by using modinfo.
As you can see the usbcore have the param nousb which is boolean, you can insert that module and using that param as example modprobe usbcore nousb=N.
Please note: we also can use modinfo for finding the full path for some module by using the -n option, as example:
1
modinfo -n dummy
This will give us the expect path for that module
Please remember that all we talk about are the modules and not the kernel option itself, like enable the NAT operation for example. Option like that can be found on /proc/sys/kernel, in this folder you will found every option that are enable on your kernel, if you want to watch the configuration file which from there you enable them, you need to check the sysctl.conf that can found on the /etc folder, in that file you can enable more functionality of the system, like enable ip forwording or such.
You also have the command sysctl which can help you to see add change the option of your operation system
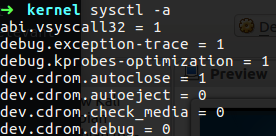 Figure 59 View the option that enable on my PC.
As an example we want to change some value of the running setting:
1
2
sysctl -w vm.vfs_cache_pressure=80
This command will change the vfs_cache_pressure to value of 80, but please note that this change are made on the running kernel, which mean if you go for reboot the default setting will come in place, if you want to make this changes permanent you need to make these changes on the sysctl.conf file.
You may ask how the linux kernel knows when some device pluge in and lunch his appropriate module, this is done by the udev, this udev responsible for such a thing so he know to load up the usb module when some USB device pluge in.
You can see what going on your commputer by using some command that related to udev, such as lsusb which can show us the devices related to usb,lspci that responsible for PCI bridge and we can use lsdev to display information about installed hardware or the dmesg that show us all the log we have from the system like in the boot which we can see on the boot the logs that our system run while bring the OS up.
We also have the udevadm monitor which can bring to the screen logs from the system in real time, you can see on the next gif how it work, I plug in my sundisk device and the udev found it and load it’s logs to my screen, he also showed us the remove log when I remove my device from that computer
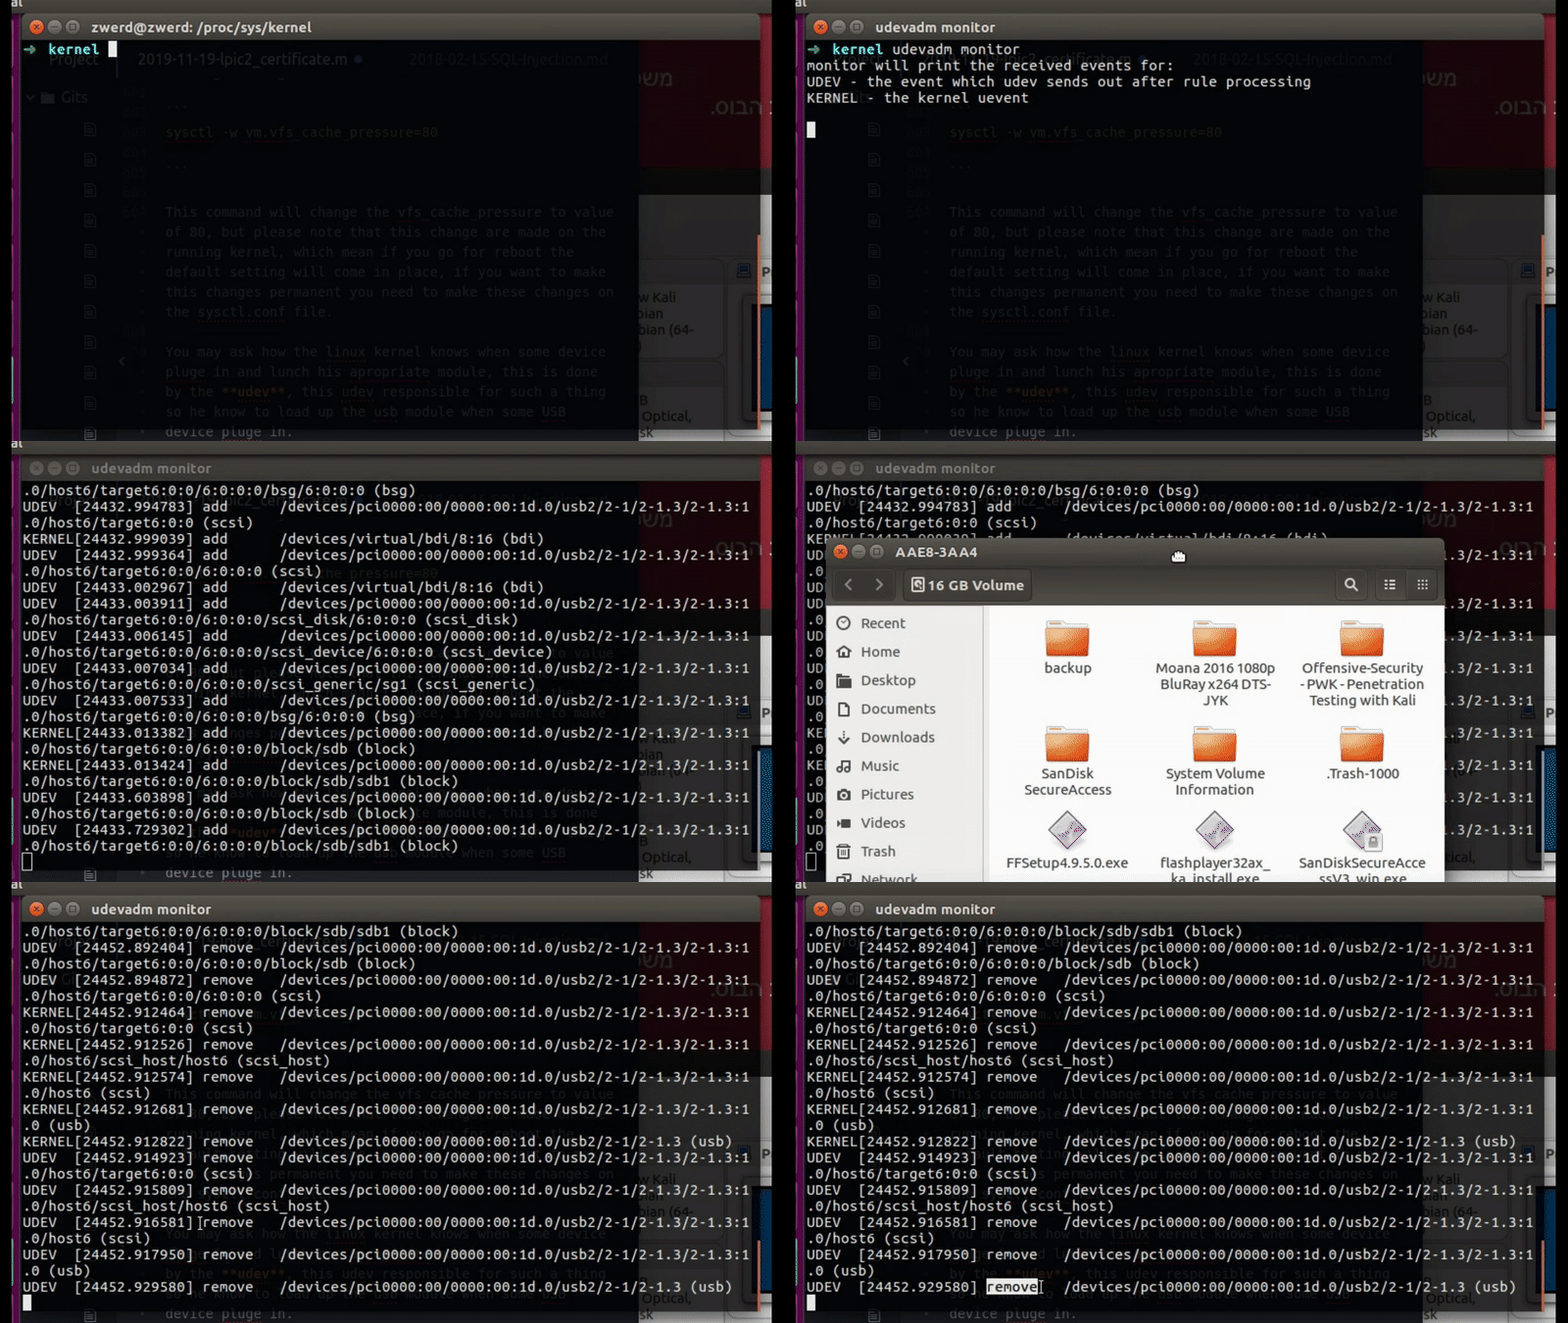 Figure 60 UDEV monitor in real time.
You also need to know that there is a blacklist of modules because let’s say that you plug in some device that have number of driver on you kernel that can support it, but you may want to use just one of them that are the best used for you.
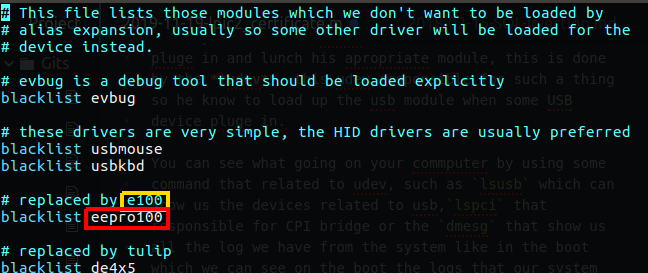 Figure 61 blacklist.conf file.
In my case you can see that in the blacklist I have the eepro100 module which mean that if Ethernet card plug in, do not use that old driver, so that is the purpose of that blacklist, you can find that file in the following path: /boot/etc/modprobe.d/blacklist.conf.
Please note: if you need to find some file that you don’t know what is path you can always run find / | grep <string> which the string stand for what you search.
Now let’s say that we want to compile our own kernel so that our kernel will be the latest kernel that can be found in the linux kernel archive.
In the reality, if you asking why you ever customize you own kernel, it can be because you have some old linux system that used for just one purpose like FTP server or somthing like that, in that case you may want to compile kernel without any modules that you know you probably won’t be in use.
So first of all, I will display here the compilation process and installation of new kernel on my kali linux which is virtual machine that I use a lot, you can read more about that in my other PWK post. My current kernel version are 5.2.0 and I am going to compile kernel 5.4.3 which is that latest version in the kernel archive at this writing time.
We need to use the /usr/src/ directory as our kernel, so after we download the source code and decompress it we need to create kernel folder or at least make symbol link to the kernel folder named kernel. After we download the kernel file from the kernel archive we can extract it by using the tar command.
1
tar -Jxvf <path to the compress file>
 Figure 62 tar the kernel file.
Than I run the following command in order to make the symbolic link to kernel folder.
1
 ln -s ./linux-5.4.3 linux
Please note that on the Linux folder that we created we have the document for every module that can be use under our system.
For compiling the kernel we need tools that can help us to do so, in my case I need build-essential which is the Informational list of build-essential packages.
1
apt-get install build-essential
If you want to make kernel on fedora like distro you may need to install “Development Tools”, qt-devel and ncurses-devel.
Now we want to customize the kernel, to do so we going to use make command, this command help us to prepare the kernel and create the configuration that needed, the make command work with target, which mean that we choose some target that tall the make what to do, as example
1
make clear
This make command going to remove most generated files, it also keep the configuration and enough build support to build external modules.
The first thing we going to do is the make mrpreper command which going to remove all generated files + config + various backup files, this will make the kernel as fresh, like let’s say that you make some kernel file but didn’t install it because you has some other thing to do, and after a while you came back to you computer so you can clean up what you did and start over.
After that we going to configure the kernel, to do so we can use make xconfig, this will bring up configuration window in GUI mode that you can setup what you need in your kernel by using you mouse and mark the setting you want.
I my Kali Linux I had a lot of issue that related to some pkg that was needed, if you have such an error, the log of that error will tell you what pkg is missing and all you have to do is apt get install that pkg.
In my case I mange to run xconfig which bring me the configuration menu in GUI mode up to the screen,
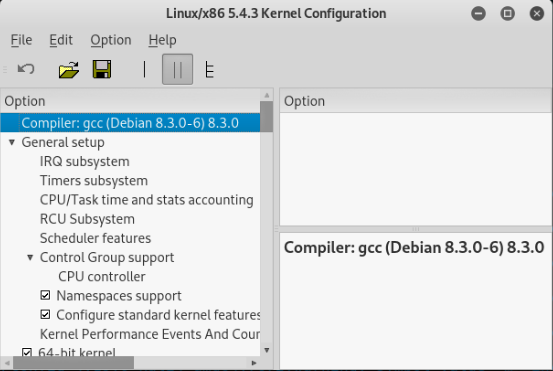 Figure 63 GUI for configuration menu.
After that case I decided to run the kernel compiling stuff under other machine, and we will continue to see more in my VM ubuntu.
On my Ubuntu I run the make menuconfig, and that bring me the menu for the configuration in my terminal, in this menu we can choose line in the xconfig the setting we want to be on our kernel.
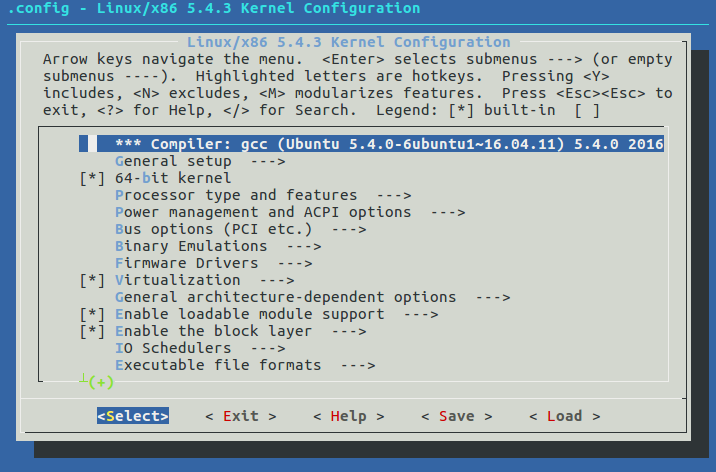 Figure 64 Setup config in terminal mode.
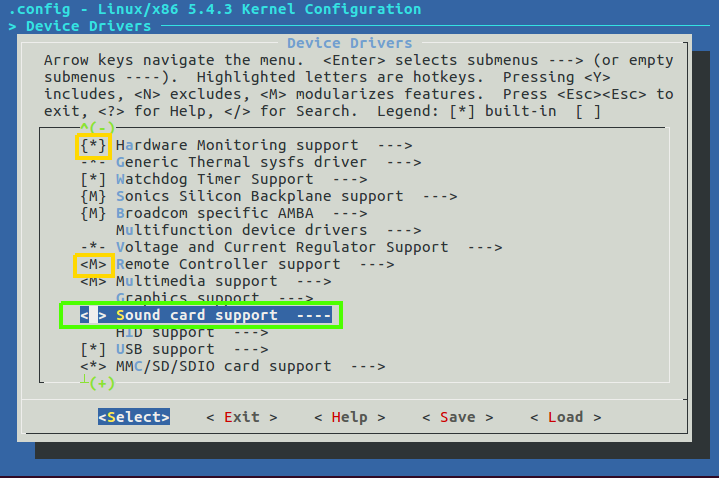
In that menu we have several option for each device driver, the M stand for module, this is mean that this driver can be use as a module if needed but it is not part of the kernel, however the asterisk sign “*“ stand for that module will be a part of the kernel and if so, you won’t be able to disable that module from your system, now, if you leave the chosen feature (module) empty, this will mean that this module won’t be available, this is mean that we won’t be able to load it to the kernel even as module.
You can see that the Hardware Monitoring support mark with asterisk which mean that this module will be loaded to the kernel, than we won’t be able to disable it, the Remote controller support will be load up as modularize feature which mean that we will be able to load or disable this module if needed, I unmark the Sound card which mean that this module are disable and can’t be use as a part of the kernel.
Now after we finish we need to save our configuration, this action will create some .config file that can be showed under our linux folder.
This file contain all of our configuration, you can also use make config, but this option will bring you a lot of questions that you must answer, and if you done any mistake you will need to start over, this is way the other option are recommended.
If you use make oldconfig it will take the configuration of the running kernel and load it up to your config file which can be very convenient if you want just enable or disable specific module.
Now we want to make the compilation, so we need to run make bzImage, this going to take some time, this command will create for us the image file. Please remember that zImage are used for tiny file (512k) and bzImage are used for more larger files.
In my case when I tried to run make bzImage I got error about the openssl that can be found, after searching this error on google I found that I need to install libssl-dev which used for openssh development pkg.
I tried to run the make bzImage again and now it work, I saw few warning messages that complain about pkg that are missing but it keep the process to make the bzImage which going to be our kernel that contain the permanent modules for our operation system.
After it done to do it’s magic, the kernel will be at the arch/x86/boot/bzImage, and now we need to compile the modules, we can done it by using the command make modules and it also will take a mount of time.
At the end of this process it will run depmod which will create the modules.dep file which contain all the modules information and dependencies.
Now I want to talk little about the DKMS, this is sort of direction about how to build specific kernel module, this is mean that the DKMS contain the configuration file to tell the system how to build/configure the module and what its name is.
Let’s take a look in my local Ubuntu system, in the /usr/src/ directory I have module for virtualbox and that module use the dkms.conf file that contain direction for build the module in my system.
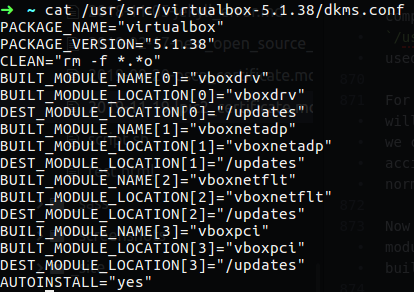 Figure 75-1 DKMS configuration file.
You can see that this file contain information about the package name, version, build module name, build module location and so on. As you already know for build module we use make command, it’s more likely that the module we going to install will be some c file and we use make to compile it, after it finish to do it magic we find in the current directory ko and o file and now we can run make install for installing the module, the DKMS can do all of that for us, we just need to specify what to do in the dkms.conf file.
Let’s go back to the make modules command we talk about erlier, so after the make modules finish we can find the modules we compile under the /lib/modules/ folder which will be contain the modules folder as the name of the kernel version we compile.
Now we need to install the modules with the command make modules_install it will install the modules under the /lib/modules/kernel-version which is the kernel version of our modules.
At the end of modules installation you will see that it run depmod which is build the list of every module and it’s dependencies, now all we need to run is make install, this command will install the kernel on our system and it use dracut which going to make some changes in our boot folder and in the GRUB to make some new option to load the new installing kernel so we can choose it one the GRUB menu, it also create the initrd which is minimal file that use in the RAM to load up the kernel.
Just think about that, you boot up your system and your GRUB need to load up your kernel, your kernel contain many modules for manage the devices parts, he need to load them up from the hard disk, but there is a problem, he can’t use the hard disk because he need module to do so and all of the module are in the hard drive, so for this issue there is the initrd, this file contain minimal modules that needed to load the hard disk for example, after that GRUB load the kernel it will be able to load more kernel modules from the hard disk.
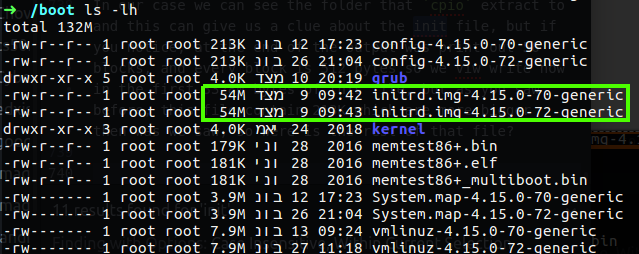
You can find the initrd under boot folder, usually every kernel have it’s own initrd, in my case my ubuntu contain 2 image of the kernel, one is 4.15.0-70 and the other is 4.15.0-72, the same numbering code have on my initrd files.
Please note:At boot time, the boot loader loads the kernel and the initramfs image into memory and starts the kernel. The kernel checks for the presence of the initramfs and, if found, mounts it as / and runs /init. The init program is typically a shell script. Note that the boot process takes longer, possibly significantly longer, if an initramfs is used.
Let’s take a closer look at this file, it will help you understand more about this file, so I’m run the command file on one of the init file to check what is the type of that file, in that way I will be able to find out how to read that file.
As you can see the type of this file is an archive and it’s cpio file which is compress, so now we know that we need to decompress this file in order to be able to read it, to do so I going to use cpio command.
 Figure 70 Extract from cpio file.
The option -i stand for extract files from an archive and the -d create leading directories where needed, the -m retain previous file modification times when creating files and -v used for verbose.
In our case we can see the folder that cpio extract to and this can give us a clue about the init file, but if you notice, at the end of the output was print out 56 blocks, and every block is 512 bytes so we view right now in the first 33280 bytes of this file, but as you saw before, this file contain 54M which are more bigger then 33K, so were is the rest of that file?
This situation let’s us know that not all the file was open by the cpio, and the rest of that can be something else or new cpio file because in the cpio there is an header that he knows the start and finish of file, so we need the rest of the file, to achieve that goal we can use dd to take fixed size for that file and output it to use file.
1
dd if=initrd.img-4.15.0-70-generic of=initrd.img-4.15.0-70-generic_OUT bs=512 skip=56
In this command I specified the input file which is the initrd.img-4.15.0-70-generic and the output file going to be initrd.img-4.15.0-70-generic_OUT, the block size are 512 bytes and we want to skip the first 56 blocks which mean the rest of that file will be taken.
 Figure 71 Create new file using dd.
What we need now is to use file again to see what is the type of our new file we have.
So this also cpio file, I used cpio to extract that file and found other files that was extracted out.
 Figure 73 Extract again using cpio.
Now we need to repeat the process again with dd and after that using file command.
1
sudo dd if=initrd.img-4.15.0-70-generic_OUT of=initrd.img-4.15.0-70-generic_OUT2 bs=512 skip=5784
 Figure 73-2 Checking the new file with
 file command.
You can see that we found gzip file so now we need to use gzip to see the contect of that file, in the gzip case the file must contain extension of gzip else we will get some error, so I use mv to change the extension and then use the gzip command.
So for change the extention:
1
sudo mv initrd.img-4.15.0-70-generic_OUT2 initrd.img-4.15.0-70-generic_OUT3.gz
And now extract the gzip file:
1
gzip -dlv initrd.img-4.15.0-70-generic_OUT3.gz
This will bring file name initrd.img-4.15.0-70-generic_OUT3 so now we need to check that file type again. in my case it was cpio.
 Figure 73-2 Decompress the gzip file.
 Figure 73-3 Checking the file type again.
So I decompress it.
 Figure 74 Extract again using cpio.
To see if this is the end of our search of initrd we can can use dd and if he print out record of zero, it’s mean that this is it.
Please nore: the kernel configuration parameters can be found on the config file, this file is also on the boot folder, so as you need to remember that you can change some parameter by make menuconfig but if you forget about some setting that you need you can add it in that file before install the kernel. Also remember that the config name is usual as follow config-<kernel version>.
So far we saw that on GRUB we have two files, the kernel file and the init file, after we done all the compiling stuff we can find the kernel and it’s documentation under the /usr/src/linux//usr/src/linux/documentation, we also can find there the drives that going to be in used on our system and the configurations files that related to this linux kernel.
For making initrd file we can use mkinitrd command (on RedHet and CentOS distro), if you use Ubuntu you will need to use update-initramfs or mkinitramfs commands, those command will create initrd file which we can move to our boot folder and update the GRUB to use it, so in case you find the initrd dummege or it accidentally deleted, you can use those command and create your new initrd file for booting the system normally.
Challenge 201-1
- Create your minimal linux kernel and archive it as iso file (you can use the minimal linux live project).
- Run the file on virtual machine and check if it working correctly.
- check if you have network activity, if you haven’t, try to solved it and check connectivity on your local lab.
To solve this issue I will go with you step by step how to make new minimal linux kernel, I am going to use the minimal linux live project that was written by davidov.i@gmail.com, you can find the minimal linux document at the following URL:Minimal Linux Tutorial.
1. Create minimal linux kernel.
So first of all I login to the following URL:https://minimal.linux-bg.org/, I download the file minimal_linux_live_15-Dec-2019_src.tar.xz, I extract the file by using tar -Jxvf and folder with the same name was created on the local directory which are contain the script file for making new ios image, the name of that file is build_minimal_linux_live.sh which is executable file.
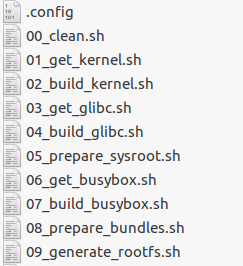
By running this file we run all of the script that exist in that folder, like 02_build_kernel.sh and 05_prepare_sysroot.sh.
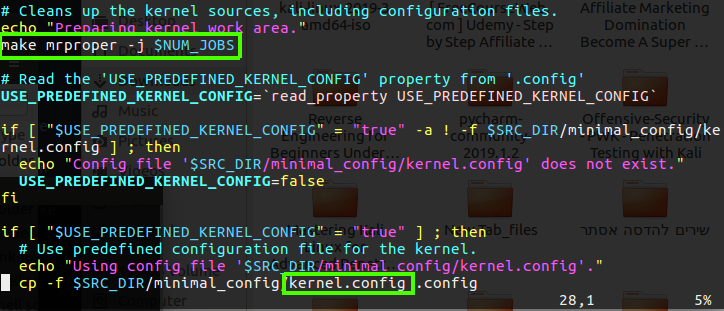
while running that script, on my terminal I saw what it did which going to create new file and setup the .config file and make it and create initramfs which going to be use under the iso file which I am going to have after that script will done it magic, and this take long time to cook, but on the second script 02_build_kernel.sh you can see that we use mrproper to clear the local config file and after that we going to create new config file base on the kernel.config file.
Now we need to find the iso file which we going to use on our virtual machine, in my case I have vbox to I am going to create new machine with that file image and load the machine up.
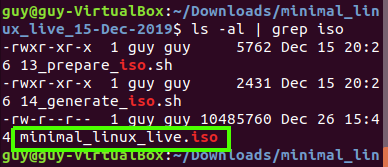
The iso was created on the current directory named ./minimal_linux_live.iso, I found that by using the follosing command.
1
find . | grep "\.iso"
Now I need to transfer that to my local machine, I not going to use usb or any sort of device, I am going to run nc again and transfer the file over my local network.
2. load up the iso file in the vm machine
So now I create new machine and set my iso file as the disk to load it at boot time.
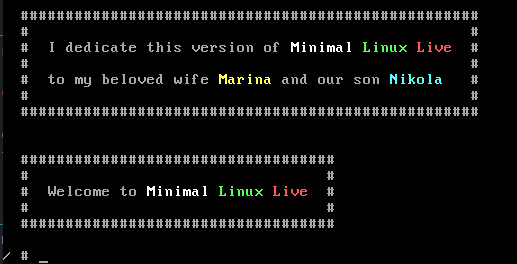
You can see that it start to boot up, and I need is to wait and see if it going to bring me some minimal linux environment with tools to work with.
It’s look good and I succesfully run some bash commands. I also have network interface with IP address that he get by DHCP.
3. check network connectivity.
I just run ping to 8.8.8.8 which is google DNS server and I saw reply from this server.
 Figure 80 Checking network connectiviry.
So we finish our challenge, so we can proceed foreword to the next chapter.
Challenge 201-2
This time we going to do something that can help us in real world scenario. It’s not something that can happen on a daily basis, but it seems to be a good exercise.
- Setup CentOS on virtual machine and after full installation on your virtual hard disk verified the initrd file.
- Go to the GRUB file and remove the initrd line.
- Remove the initrd file and reboot the system.
- After you found out that the system can not start, find the way to soled it
1. setup CentOS on VM and verified the initrd file
So, I download the file from CentOS site, I chose the CentOS 6 for that exercise but you can do the same on more advance system.
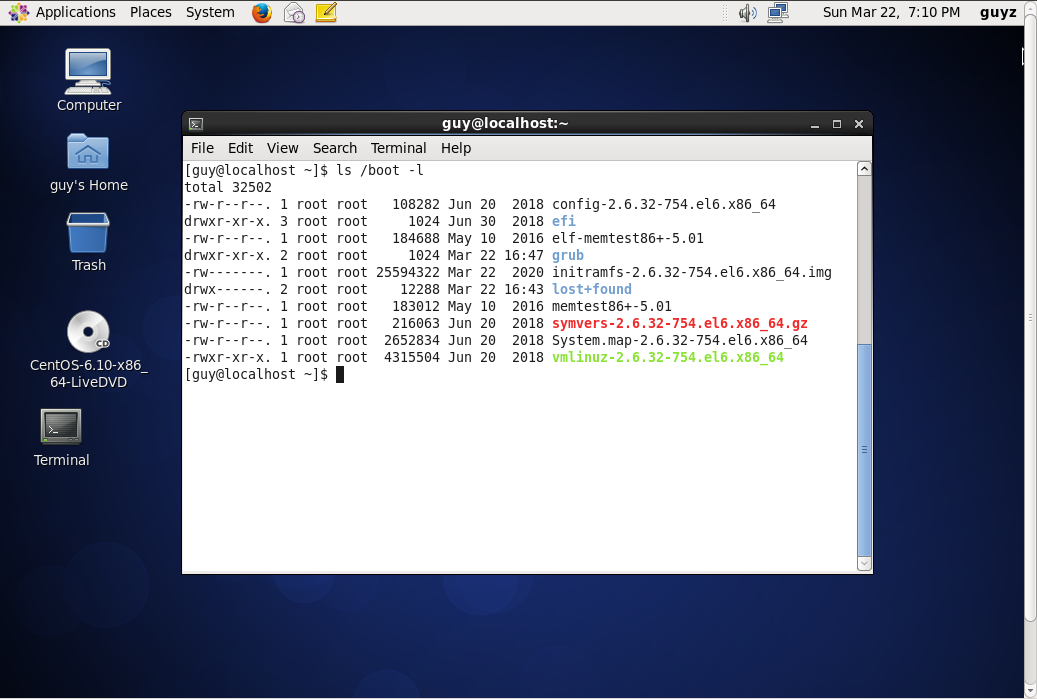
In the first step I make new virtual machine and load it up with the ISO file of the CentOS. After it cam up I start the installation and wait for it to finish. After that I restart the system and load it up from the virtual hard disk and checking the system, I found the initrd on the boot folder.
2. Remove the initrd line from GRUB
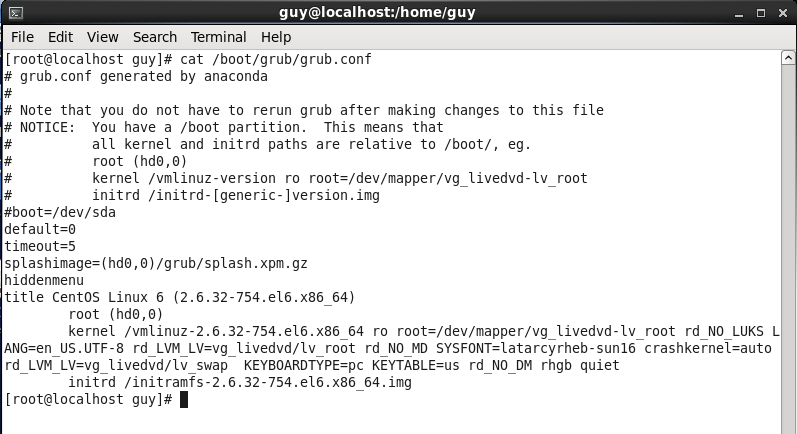
You can see the I have folder named grub which is contain the GRUB configuration on my local system, I need to change it and remove the the line that contain the initrd, this line is used to load up some minimal modules to load the hard disk.
I remove the line by using vim, you can also use nano if vim is difficult for you but remember that knowing to use every tool in Linux will help you as you proceed foreword.
3. Remove the initrd file
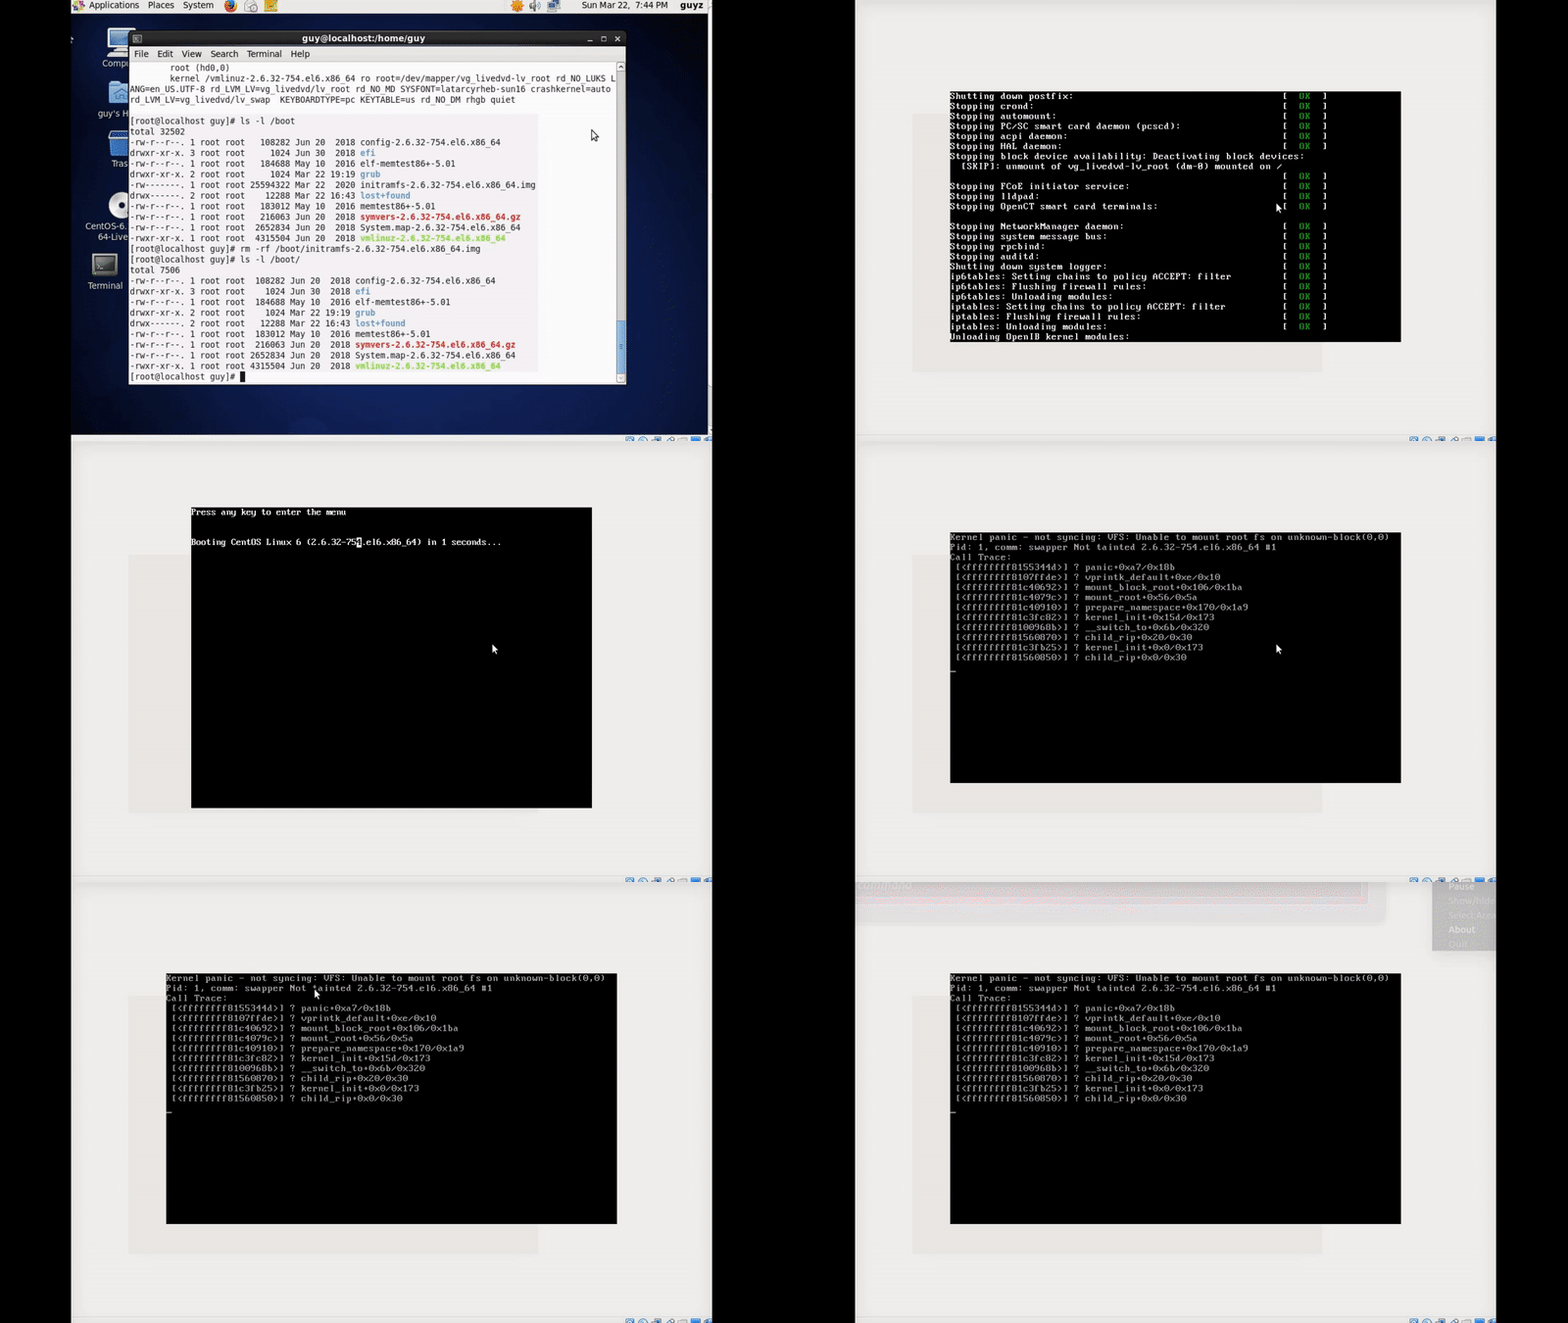
Now I need to remove the initrd file from my boot folder, so I use the rm -rf, but before that I verified the file on the boot folder to see that is exist.
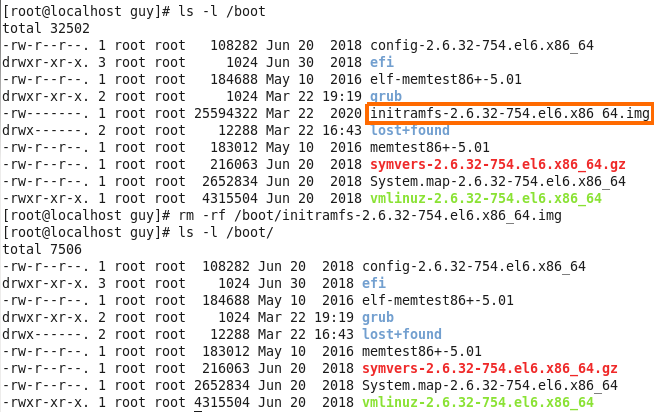 Figure 81-2 Remove initrd file.
4. Reboot the system and fix the issue
Now this is time to reboot the system to see if it can boot up normally. In my case it stack on black screen without any way to stop the start process, so I power off the system.
So let’s say that your friend can’t boot up the system and he knows that you are an expert in everything that related to Linux so he ask for help, in that case we can see the line that said:
1
kernel panic ... can't mount root fs ...
In that case we know that the kernel tried to load up the root filesystem and he tried to do so with the initrd, so if we get such an error it because he cannot find the initrd file.
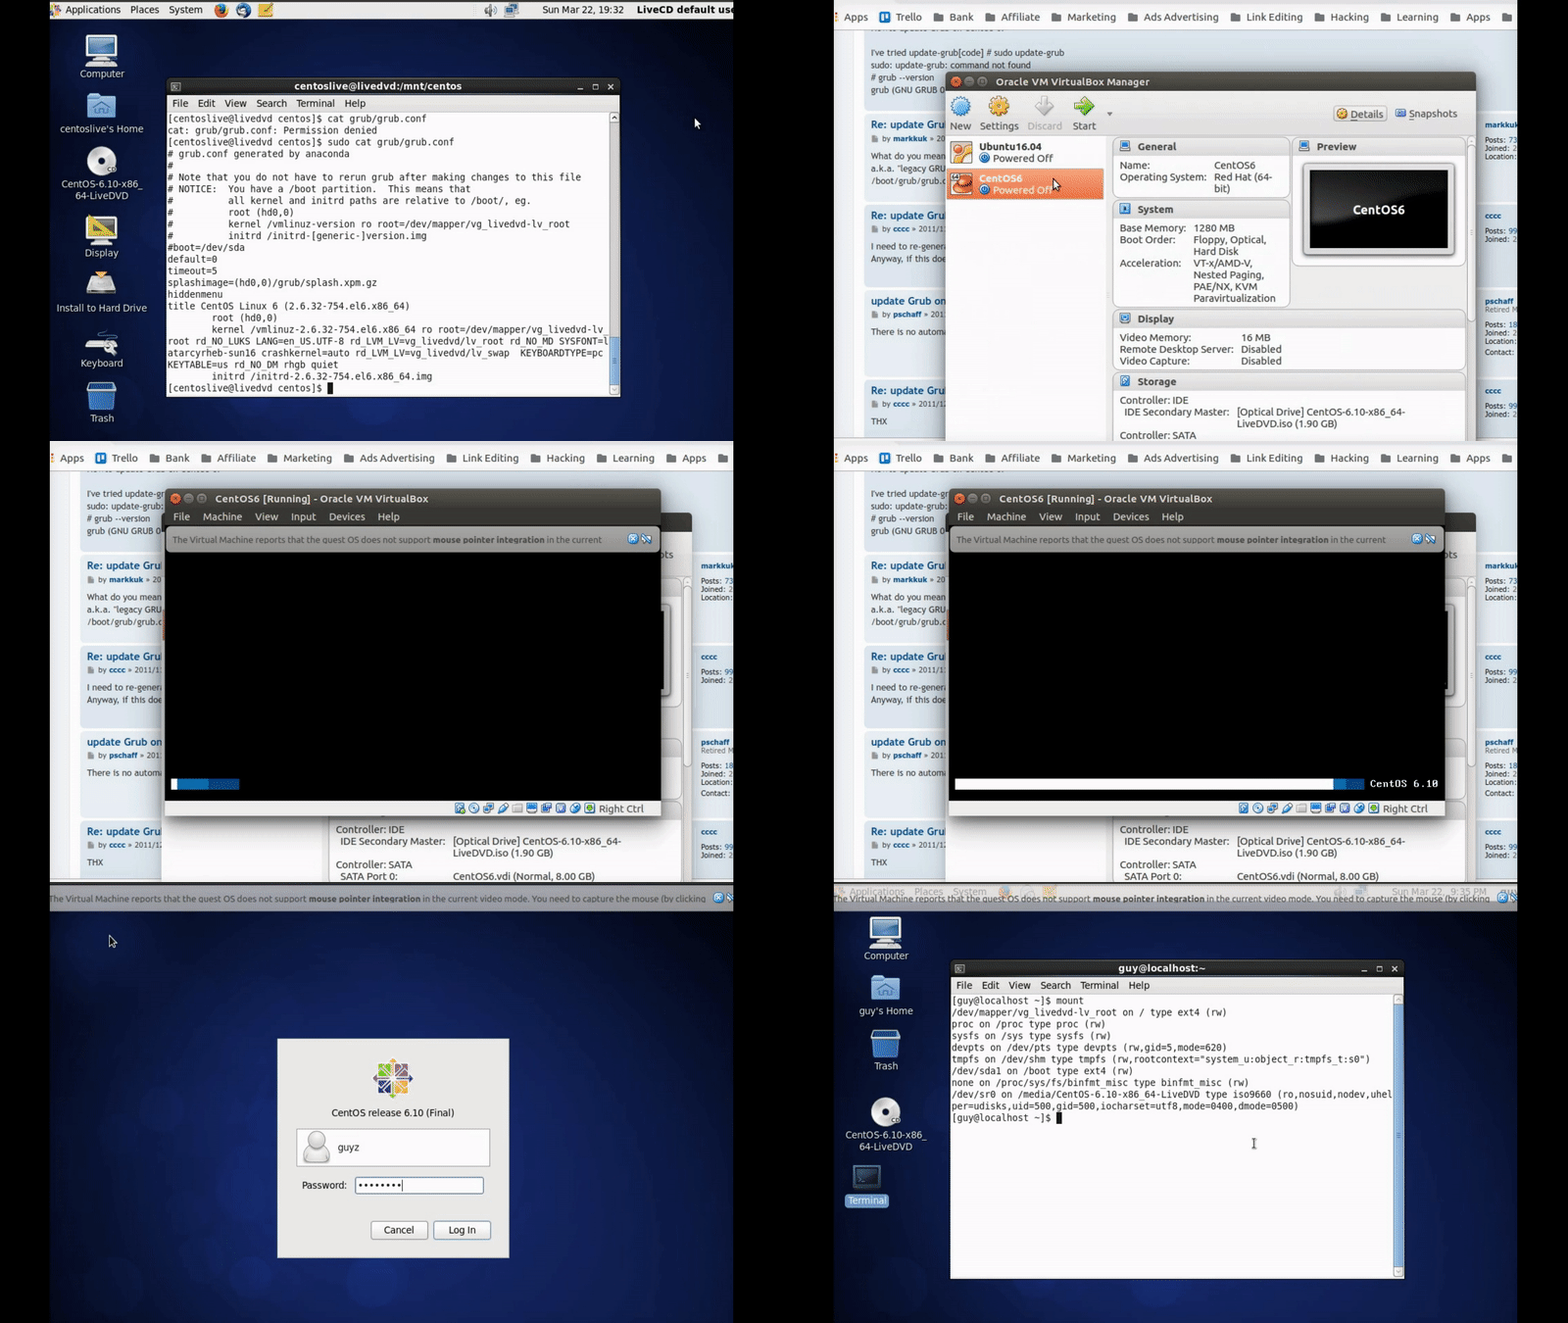
To solve that I boot up the system by using external device like bootable usb or optical disk and bring the system up for making change in the boot folder for that system.
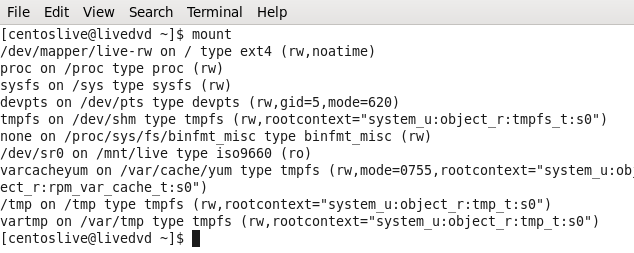 Figure 81-4 Mount command after boot from bootable device.
You can see the I have not any /dev/sda storage in that system becouse I boot it up from optical disk, now I need to find the hard disk and mount it to my system.
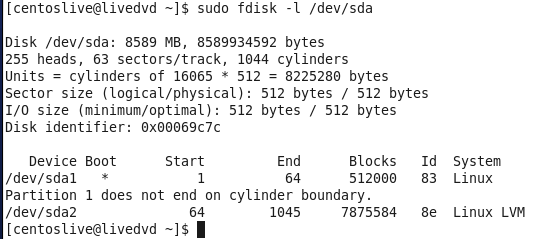 Figure 81-5 My local hard disk using fdisk.
Now after I know what is my hard drive I need to create mount point, which is in my case going to be /mnt/centos/ folder and I create that folder by using mkdir, after that I need to use mount for mounting the hard drive to that point.
You can see that I had to run it with root privilege for making the mount point and mount that drive, now I need to see what I have on that folder.
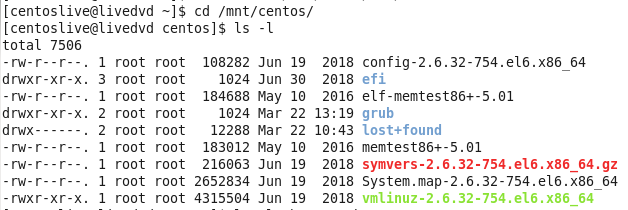 Figure 81-7 My centos boot folder.
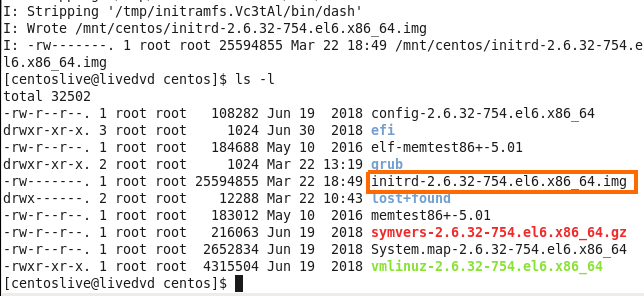
So I need to create new initrd file, I can do so with the mkinitrd command, in my case I want to specified the kernel version and I know that my bootable optical disk is in the same version so I use the uname -r which bring me the version of the system and create the file with that system code number.
1
mkinitrd -v ./initrd-`uname -r`.img `uname -r`
You can see that the image was successfully created.
Now I need to update the grub file, on my system I use GRUB1 so I have not any automatic way to update the grub, I need to do so manually.
So I use vim to edit the GRUB file and I add the initrd line which contain the path to that file.
1
initrd /boot/initrd-2.6.32-754.el6.x86_64.img
After that I reboot the system to check if it working right.
Chapter 2
Topic 202: System Startup
In linux systems we have the way to control the system mode we going to load up, we have numbers of system mode that some of them very useful and some of them are not in use, as example one of them is full system mode that contain everything that normal system need contain for work, we have also single user mode that can be use to do specific thing on the machine, that sort of control tool called runlevel. In the Linux world we can use run level to boot up specific mode of our operation system.
We can setup also runlevel as we want, as example we can create runlevel that enable on the system the mail service and disable apache2, in that way we can customize the system with specific tools and program that can be work on it, this is quite useful because let’s say you have user on your organization that use tools that related to design pictures or document and he need connectivity to the network and nothing else, in that case why we allow the vsftpd service for example, this is not useful for that user, so we can disable that on customize runlevel.
If we talk about systems like Red Hat systems in my case centOS you can run runlevel, this command will show us the runlevel that our system run for, in my case it was N 5.
 Figure 82-1 My runlevel on centOS.
The 5 means that we working now with runlevel 5, the N means that the previous runlevel was none, if we change the run level for 3, the numbers will be 5 3. To change the runlevel on the running machine we can use the telinit.
1
telinit 3
You can see that I am in command line level, so in that case I can change it again to level 5 and it will bring up the GUI environment again, you can see now that if I run runlevel command I can see that the last runlevel was 3, and now it set on level 5.
Now let’s look on the configuration file of that inittab, you can find that file on /etc/inittab, this configuration file contain several init level. 0 - halt which mean that if we use that init, the system will go shutdown, this is why it is recommended not to setup the runlevel at this init level or at level 6, 1 - single user mode for administrative tasks, 2 is multiuser mode without NFS and 3 is fill multiuser mode, 5 is x11 which have the nice GUI view with desktop environment.
 Figure 84 inittab file on centOS.
You can see on the bottom of that file the line id:5:initdefault:, we can change it value to what init level we want and on the next boot it will bring the new init level up, what you mast not do on that file is to setup the run level for 0 or 6 which cause your system won’t be able to load the user enviroment and we can’t work in that case.
If you want to see your level on Debian like as Ubuntu you can also run runlevel command or check your sysinit.config file on /etc/init.d folder this file contain the init level for distribution like Debian and you can change it what ever you like but please notice that this run level in my case on Ubuntu is pretty different from Red Hat like distrabution, in my case I found that information in the man page of telinit file.
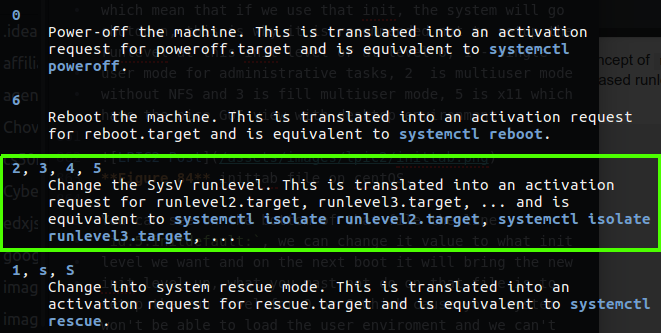 Figure 85 Runlevels on Ubuntu.
You can see that the most used are 2, 3, 4, 5 and they call it SysV instead of runlevel. You also can see the current runlevel you run on Ubuntu on the rc-sysinit.conf file.
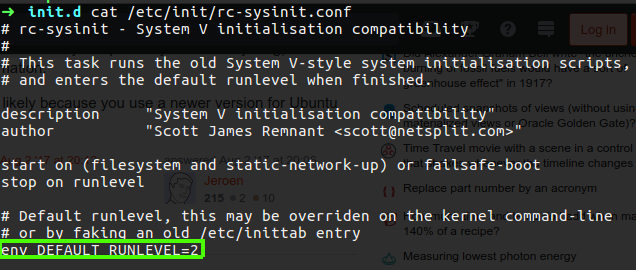 Figure 86 rc-sysinit.conf file on Ubuntu.
Please note:we can set the runlevel also on the boot loader which in my case is the GRUB and we can specify the RUNLEVEL we want on the menu.lst and run grub-install and every time the system will reboot it will use this RUNLEVEL.
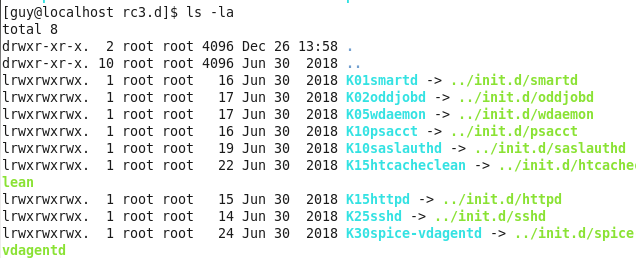
Let’s go back to centOS machine, we have folder called rc.d which contain the folders for each runlevel, as example the rc3.d is conatin simbolic link of the utility that going to be active on that run level.
Every simbolic contain in it’s name sign for it’s operation on that system, as example as you can see the first one utility is K01smartd the K stand for KILL which mean that this smartd will kill down if we change the current run level to number 3 on flay, the numbering is the sort of every utility, which mean the system will go every utility and take care of it, in my case the smartd will killed first and oddjobd is the second one service that going to be kill.
We also have service with their name contain S which stand for start, in that case the system will go one by one and start every such service, so as you can see we can change specific runlevel and disable it’s working services or enable others by just chaning the name of the simbolic link, as example in the case of K01smartd.
1
mv K01smartd S01smartd
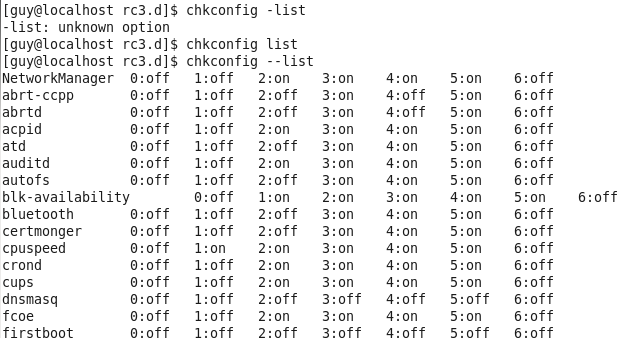
In that case if I switch to run level 3, I will be able to use smard service. You may also notice the numbering on every service, this number are allow us to choose the order of execute every service under this run level, We also change use tool to do that task chkconfig, if you run chkconfig --list it will bring you the list of every service and it’s operation state of every run level.
Please note: this chkconfig command is available on operation systems like RedHet, CentOS etc.
In my case I run the following command.
1
chkconfig smartd on
This will bring the smartd to be active in run level 2 - 5.
 Figure 89 list on chkconfig - smartd are active.
To change this service mode back you just need to use off option.
1
chkconfig smartd off
On Ubuntu the rc folders can be found under /etc and the concept is the same as we saw on centOS, the difference is on the change mode utility, in Ubuntu it’s update-rc.d and it’s do the same as we done with chkconfig.
1
update-rc.d dnsmasq start
If you want to change the operation state permanently you need to use disable or enable instead start or stop. You can also remove it from the symbolic links with the remove option.
So far we saw the command chkconfig --list that can help us to view all the services on centOS system or any Red Hat like distribution, on Ubuntu we can use the command netstat -tulpn as we saw on chapter 1, but for the matter fact we can use more handy command like service --status-all, this command will show us every service that exist on our system and each status.
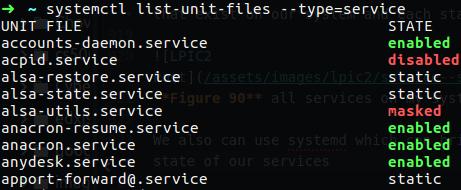
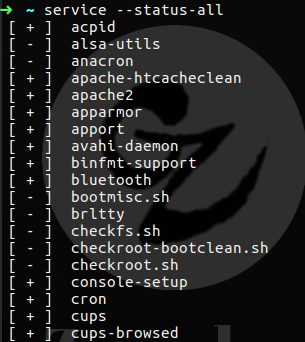 Figure 90 all services on my system.
We also can use systemd which can bring us more clear state of our services, all we need to do is to run systemctl.
Systemd can used to define the system state, we have extensions named .target or .service and etc, for example ls /usr/lib/systemd/user this command will bring us list of file in the user folder and you will see some services there.
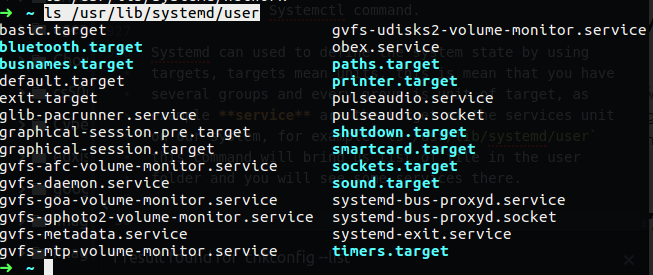 Figure 91 systemd user command.
On figure 90 you can see that some services are enable and some of them are disable, the services that are on static state means that they have some service that they depend on, so if you want to kill that service it’s can’t be done until we will stop the depended service.
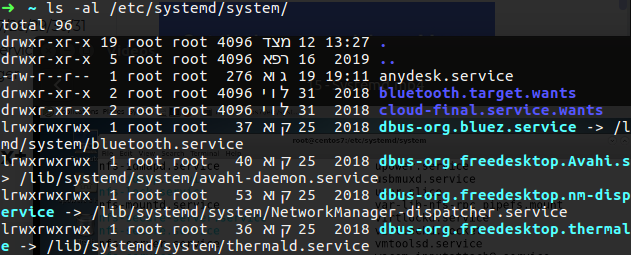
So we saw that the services are lived in /usr/lib/systemd and also in /etc/systemd/system, if we take a look on one of them we will see some lines that systemd use them to know how to start or kill service.
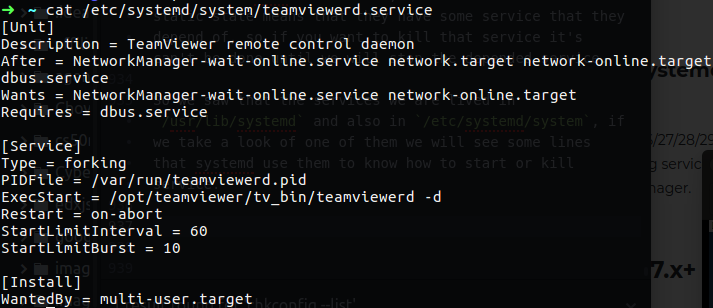 Figure 92 the service itself on system.
As you can see this file contain some description and after field, this after field mean that the services - NetworkManager-wait-online.service network.target network-online.dbus.service, must be on enable state and only after that was done, we can bring the teamviewerd.service service up, so in that case the dbus.service must to be run before we can be able to use teamviewerd service, so if we run the following command we will see that dbus is on static as we saw on figure 90:
1
systemctl list-unit-files --type=service | grep dbus
you can see also the ExecStart field that contain the exact command for running that service.
There is also a third location available in which you can place files to override your unit definitions, this is the /run/systemd directory. I want to do some experiment (credit filbranden) We have the /run/systemd directory that contain the systemd notify, as much as I understand this norify allows a process to send a notification to another process, so let’s create our own service and look about the status of that service.
First of all we create a script like the one below somewhere in your system, such as /usr/local/bin/mytest.sh:
1
2
3
4
5
6
7
8
9
10
11
12
13
14
15
#!/bin/bash

mkfifo /tmp/waldo
sleep 10
systemd-notify --ready --status="Waiting for data…"

while : ; do
        read a < /tmp/waldo
        systemd-notify --status="Processing $a"

        # Do something with $a …
        sleep 10

        systemd-notify --status="Waiting for data…"
done
We use sleep 10s so we can see what’s happen, when watching the systemctl status mytest.service output. Now we need to make the script executable:
1
$ sudo chmod +x /usr/local/bin/mytest.sh
After that we need to create /etc/systemd/system/mytest.service, with contents:
1
2
3
4
5
6
7
8
9
[Unit]
Description=My Test

[Service]
Type=notify
ExecStart=/usr/local/bin/mytest.sh

[Install]
WantedBy=multi-user.target
Now we need to reload systemd (so it learns about the unit) and start it:
1
2
$ sudo systemctl daemon-reload
$ sudo systemctl start mytest.service
Then watch status output, every so often:
1
$ systemctl status mytest.service
 Figure 92-1 My test service is on active state.
You’ll see it’s starting for the first 10 seconds, after which it will be started and its status will be “Waiting for data…”. Now write some data into the FIFO (you’ll need to use tee to run it as root):
1
$ echo somedata | sudo tee /tmp/waldo
And watch the status:
1
$ systemctl status mytest.service
It will show the status of the service as “Processing some data” for 10 seconds, then back to “Waiting for data…”.
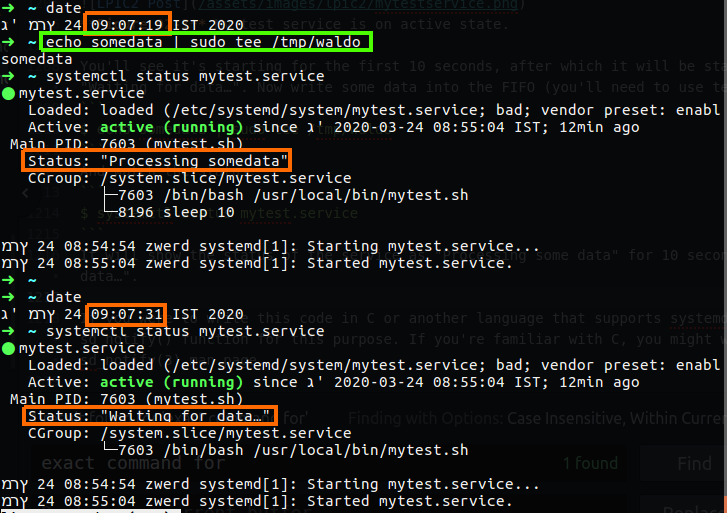 Figure 92-2 My test service status.
If you check, you will find that most of the services are symbolic link to other location and most of them are for /lib/systemd/system.
If we will use the list-units option in systemctl we will may see some services that was failed on the boot time or later, in this case if that service are importance we can bring it up by start it, or enable it.
For summery, this systemd with the systemctl command is another way to check and set the init files, this is also applied on many linux system like Red Hat and opensuse servers for enterprise, there is some distribution that don’t use systemd, but this is only on the desktop linux version, it’s more likely to find systemd in used on enterprises systems.
We also need to be familiar with systemd-delta, it may be used to identify and compare configuration files that override other configuration files. Files in /etc have highest priority, files in /run have the second highest priority, …, files in /usr/lib have lowest priority. Files in a directory with higher priority override files with the same name in directories of lower priority. In addition, certain configuration files can have “.d” directories which contain “drop-in” files with configuration snippets which augment the main configuration file.
Now, for this chapter 2 we need also be familiar with GRUB legacy and GRUB2, this GRUB stand for GRand Unified Bootloader, this is bootloader which mean this is the first menu that the computer bring up, GRUB is a modular bootloader and supports booting from PC UEFI, PC BIOS and other platforms, in this menu we can choose what operation system we want to load up, let’s say that you have some DELL PC and you want that one partition will be Windows and the other contain Linux, you can do so and the GRUB is the menu which bring you the option to choose between the OS’s.
You must also be familiar with the different between those two, GRUB legacy is the first version of that GRUB project and on the most linux version you may see that GRUB is on version 0.97 like as follow in centOS (version 6)
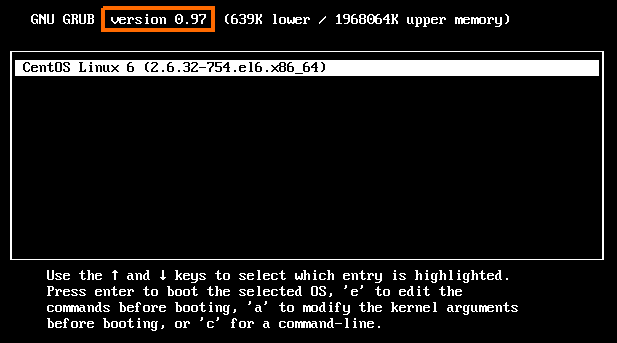 Figure 94 GRUB 1 which is the GRUB legacy.
You can see that in my case the GRUB menu doesn’t contain any other option except centOS 6, I want to show you how this is done, so for that case I download Ubuntu 9 which contain GRUB legacy, I also will install Windows XP on my virtual machine and I will create two partition which one of them will contain the Linux and the other will be Windows, please note that windows contain some different boot loader but this is beyond the scope of our LPIC2 exam.
If you want to do this exercies on you virtual machine you can download Ubuntu 9 from the following URL: https://old-releases.ubuntu.com/releases/9.04/ubuntu-9.04-desktop-i386.iso
You can also find the Windows XP on the following link: https://ia802908.us.archive.org/26/items/WinXPProSP3x86/en_windows_xp_professional_with_service_pack_3_x86_cd_vl_x14-73974.iso
Product key for windows XP:
1
3D2W3-8DJM6-YKQRB-B2XDB-TVQHF
What we going to do is to install the Windows XP on virtual machine and after that load up the Ubuntu 9 from bootable device and load up the Ubuntu, this Ubuntu will sense the windows and it will ask us to done the installation side by side the Windows and for that he will create partition for it’s installation and will setup the GRUB legacy menu for us.
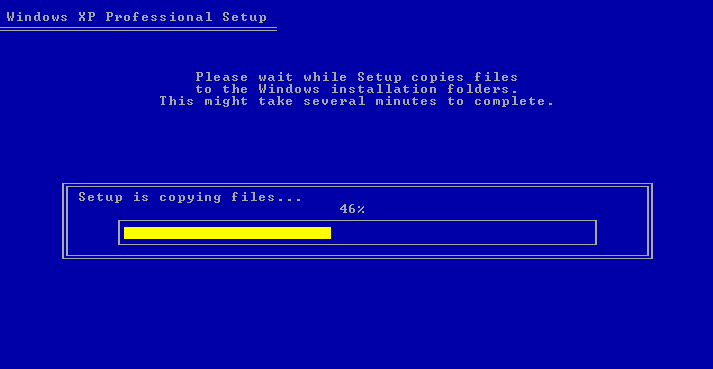
So first of all I install windows XP on my virtual machine, this task doesn’t take long time to do, just run through the installation processes till it finish.
After it done I had clean and nice desktop so now it time to start the Ubuntu through bootable device and checkout what append.
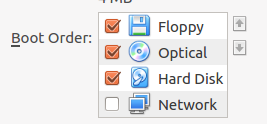
I am usin virtual box as my virtual machine so I added new optical disk which is my Ubuntu9 and bring that optical disk to be on the first option in my boot order.
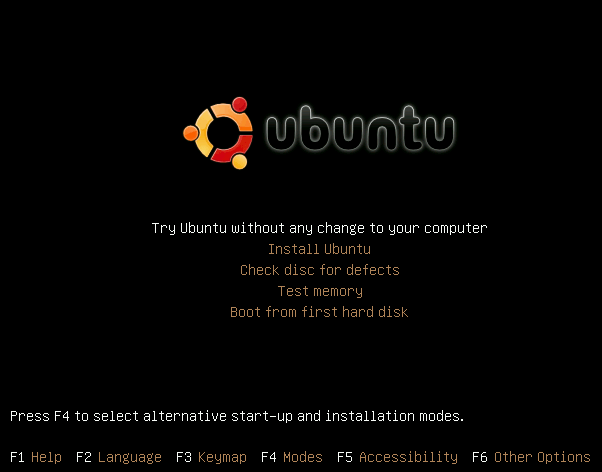
I start the virtual machine again and my Ubuntu popup it’s installation manu.
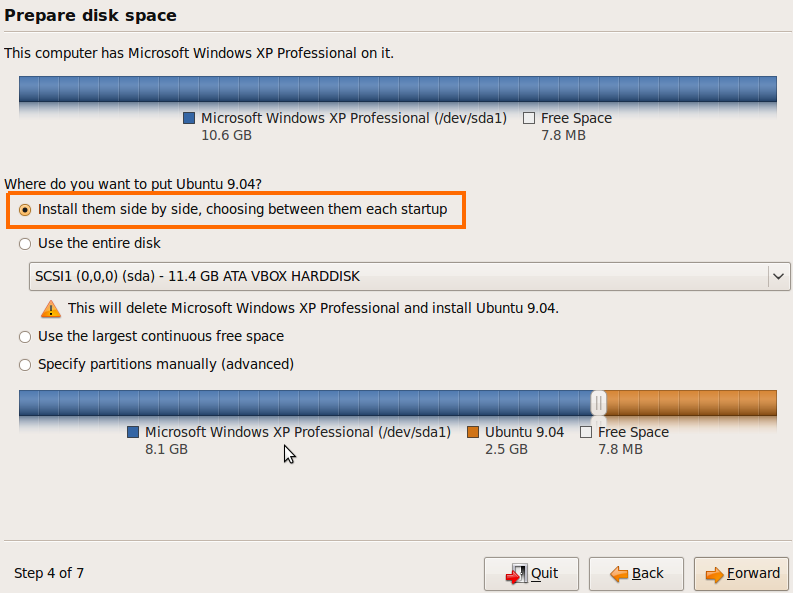
In the installation menu my Ubuntu detect that there is an Windows XP installed on the hard disk, so it give me the option for install the Ubuntu OS side by side the Windows OS.
After I choose that option it resize the partition size for me, now al I have to do is the usual staff, to choose user name and password for that OS.
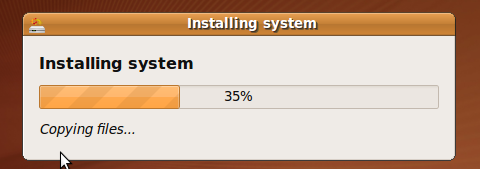 Figure 100 Ubuntu 9 installation process.
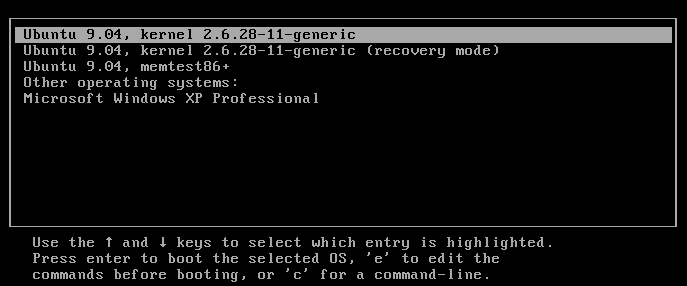
After it finish it restart and bring up the GRUB menu, however it’s doesn’t show me what is the version which normally on the upper bar menu.
I boot up my Ubuntu 9 to view the GRUB menu, to check the version just run the GRUB-install --version, this command will print the current version of our GRUB.
in the case of GRUB legacy we have two file that are important, the first is menu.lst which is pointer file to GRUB.conf, the second is GRUB.conf which contain the configuration file for the GRUB menu. In Ubuntu 9 we only have menu.lst which we can change if we want to change the GRUB menu.
In the menu.lst file there is many option that comment out, the most importance thing is can be found on the end of that file, the kernel option and initrd.
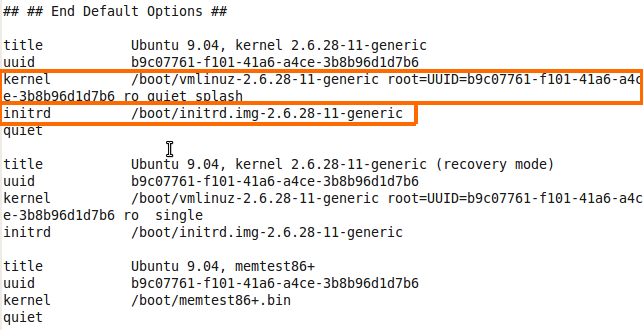 Figure 103 GRUB options in menu.lst.
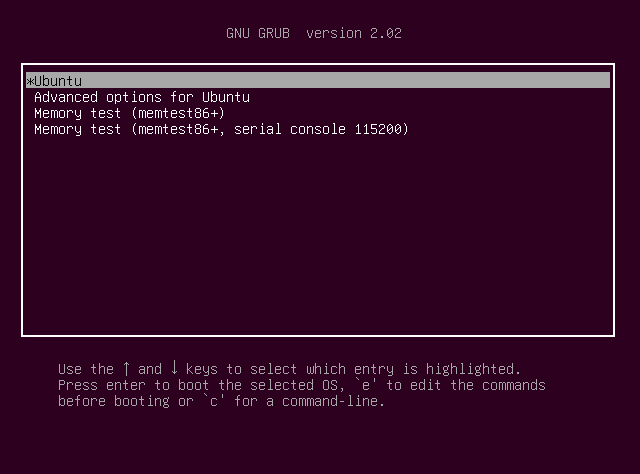
Please remember that if you have some issue with GRUB and after boot you find yourself in GRUB> command line, you can type help which will reveal the command that can be use, but you can also setup the kernel path for the kernel file and the initrd as the same you saw in the menu.lst file.
Please note: example for such case to jump in the grub> command line is when the kernel file is missing, so check the menu.lst again after you fix that error and specify the kernel from the grub> line.
You also need to specify the root partition, which in our case can be a problem because this is some UUID with some long number that must be specified, so if we don’t know the UUID we can bootup from some bootable device and find that information on the /etc/fstab file.
We will see more as we proceed, now I want to show you the same on centOS, in the operation system we have the GRUB.conf which is the pointer to menu.lst
 Figure 105 menu.lst on centOS.
In that case we have ‘mapper’ which is long, this also can be found in fstab file as we saw earlier.
If for some reason you get stack on GRUB> and you know shorly that this is GRUB2, for your kernel file you need specified the linux with it’s vmlinuz file and the inited file, you can also use ls command which reveal the partitions and set which will give you clue about all value that are set on your GRUB, and if needed change every value you need.
Please remember that like in GRUB legacy you must specified the root partition with the linux kernel line on the GRUB2.
You can also practices on the GRUB menu without to mack changes on your actual system, juest when the GRUB menu reveal it self, press c for command line or e for edit the chosen line in the menu.
 Figure 106 GRUB 1 command line.
After you finish up the settings just type boot and it’s will boot up the system with your config, if you set it correctly it will bring up your system, if not it will bring the GRUB menu again and it is the same in the case of GRUB1 and GRUB2.
Please note: you can add the GRUB parameter for the kernel, as example let’s say that we want to use amount of CPU core in that operating system, so we can use the maxcpus=1 for setting 1 CPU core to be in use when the system is boot up, in that example this is the kernel parameter, you can see all parameters you have correctly on your system by using sysctl -a, I will talk about that later on that post.
After you familiar with GRUB you need to know little bit about BIOS and EFI, the BIOS stand for Basic Input/Output System this is the lower layer on the PC, if you not already know how your system is boot up or more likely what is the order on the computer, so is as follow:
- BIOS - loads and executes the MBR (Master Boot Record) boot loader
- MBR - loads and executes the GRUB boot loader
- GRUB - loads and executes Kernel and initrd images.
- kernel - Mounts the root file system as specified in the “root=” in grub.conf then it executes the /sbin/init program which going to be the 1st program that executed (with PID of 1), it also use the initrd as a temporary root file system until the kernel is booted and the real root file system is mounted. It also contains necessary drivers compiled inside, which helps it to access the hard drive partitions, and other hardware.
- init - Looks at the /etc/inittab file to decide the Linux run level.
- Runlevel program - When the Linux system is booting up, you might see various services getting started. For example, it might say “starting sendmail …. OK”. Those are the runlevel programs, executed from the run level directory as defined by your run level.
Now let’s talk about stage 1, your computer can be with BIOS or UEFI, in my case I run the dmesg and grep the BIOS out:
So in my case I have BIOS here, but if you have UEFI you may know the grate news about UEFI, it have advantage over BIOS, first of all it have more faster in initializing for your hardware, second it offer Secure Boot which means everything you load before an OS is loaded has to be signed. This gives your system an added layer of protection from running malware. third BIOS do not support a partition of over 2TB and UEFI does! Fourth Most importantly, if you are dual booting it’s always advisable to install both the OS in the same booting mode.
If your computer have UEFI you can install efibootmgr and run it to see the EFI variables, in my case it just popup the following message:
1
fibootmgr: EFI variables are not supported on this system.
So far we talk about the GRUB boot loader, but there is more typical boot loader, SYSLINUX, ISOLINUX, PXELINUX, we need to be familiar with those so let’s look what we can do.
So first of all you must remember the following fact:
- The original SYSLINUX used for booting from FAT and NTFS filesystems.
- The ISOLINUX used for booting from CD-ROM of ISO 9660 standard.
- The PXELINUX used for booting from network server using Preboot Execution Enviroment (PXE) system.
- The EXTLINUX for booting ext2/3/4 filesystem.
SYSLINUX is not normally used for booting full linux installation since Linux is not normally install on FAT filesystems, instead it is often used for boot or rescue floppy discs live USBs or others lighweight boot system.
The Syslinux packege contain all of those boot loaders (syslinux, isolinux, pxelinux and extlinux) for supporting any situation of booting, the advantage of Syslinux it’s easy to configure and easier to manage than GRUB.
Let’s take a look on syslinux, please remember that the all others boot loaders are pretty much the same process for using them. In the syslinux boot loader we going to be experiment so bear with me, first of all we going to use USB drive on VBOX and run from that the syslinux menu.
At first we need to make the USB, which is mean to format it and create partition on it, so we use fdisk for that task, after that we use mkfs.vfat which going to prepare the drive for support FAT filesystem, in my case I also changed the USB label name by using the command fatlable /dev/sdb1 Multiboot, as you remember the SYSLINUX is booting from FAT or NTFS, after it finish to do it’s magic, we need to run the following command:
1
sudo syslinux -i /dev/sdb1
This command going to install syslinux on the first partition on our USB drive, this is mean that after it done we will find the following filesystem:
1
2
ldlinux.c32
ldlinux.sys
Of course don’t forget to mount the USB for using that and view the installed files. Now we need to copy more files to our USB drive which can be found on /usr/lib/syslinux/modules/bios/ directory:
1
2
3
libcom32.c32
libutil.c32
vesamenu.c32
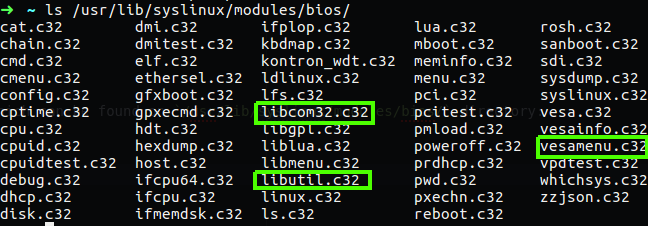 Figure 106-2 Syslinux files for BIOS.
After that I used for copy the mbr folder (which also can found under /usr/lib/syslinux/ directory) and also created the syslinux.cfg file by using touch syslinux.cfg which is the configuration menu to this boot loader and we need to edit it, I am using vim but you can use any editor you like
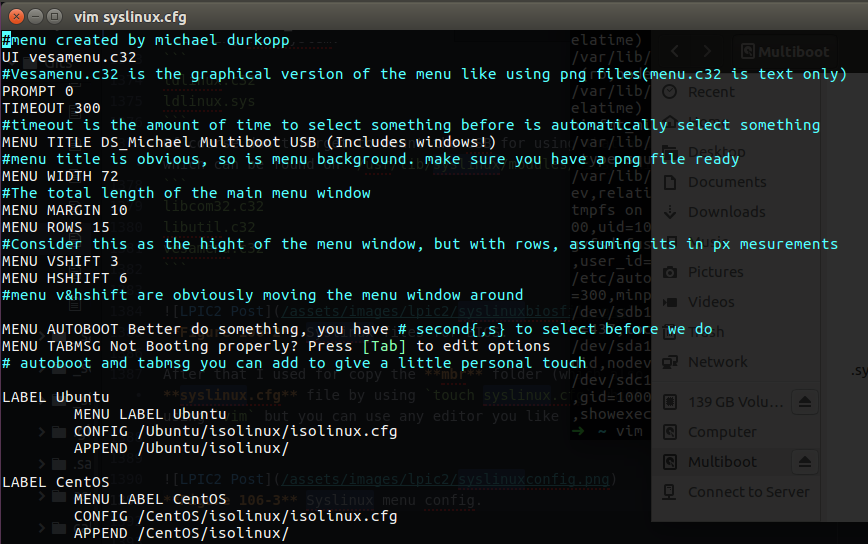 Figure 106-3 Syslinux menu config.
You can see the comment out line which can help you to understand what each line mean, please note that the UI vesamenu.c32 line call the vesamenu.c32 file and the TIMEOUT 300 mean wait 30s befor load the default OS LABEL, we also have the LABEL name and is’t menu that contain the path to the configuration file which is isolinux. So in my case I have two of them, Ubuntu and CentOS, so in my USB drive I use sudo mkdir Ubuntu ; sudo mkdir CentOS commands for these directories and copy all of the files from live iso file to my local file, if you do so you may get the errors as follow:
 Figure 106-4 Error for symbolic link whill copying Ubuntu files.
 Figure 106-5 Error for hard links whill coping CentOS files.
You can ignoring these error, it occur becouse on the FAT filesystem we have no such thing like symbolic links. So now we need to run last command and boot that USB drive.
1
sudo dd bs=440 count=1 conv=notrunc if=/mnt/Multiboot/mbr/mbr.bin of=/dev/sdb ; sudo parted /dev/sdb set 1 boot on
This command will copy the mbr.bin file to the first sector of my sdb drive, this will allow the BIOS to load the MBR which going to load the SYSCONFIG right after that, the second command will set the first sector to boot on.
Now, if you like me using VBOX you need to add USB drive to the machine, you may see some issue we that so you need to install the following package:
1
Oracle_VM_VirtualBox_Extension_Pack-5.1.38-122592.vbox-extpack
Please note that in my case I donwload the version 5.1.38-122592 which is my VBOX version, you can see the version by press Help>About>version in the bar menu of your VBOX, and download that package from the VBOX site, please note that you need the vbox-extpack for this case, after you run that you will be able to chose USB to load up the virtual machine and use it, also please remember to choose USB 1.1!
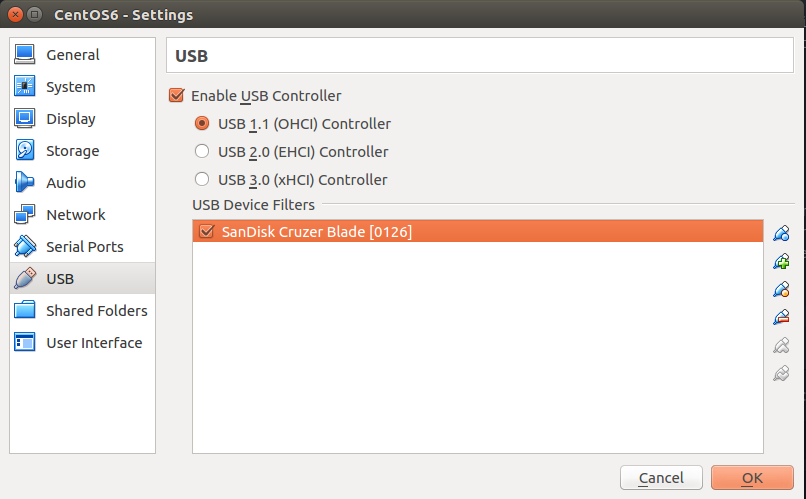 Figure 106-6 Adding USB drive to the vm.
Now there is more part we need to do, in normal computer we can choose over the BIOS which drive we want to be first booting up, so we can choose to load the USB, but in vbox we can’t choose USB as the first device to boot up, all we can do is to using floppy or hard drive or virtual optical disk or network boot device, so for that case we going to use plop.iso as virtual optical disk, this menu can help us to choose what device we want to load up, you can download if from that link, just download the zip file and you will find there the iso file you need.
Now change the boot order on the vbox system menu for that the optical disk be the first boot before the hard disk.
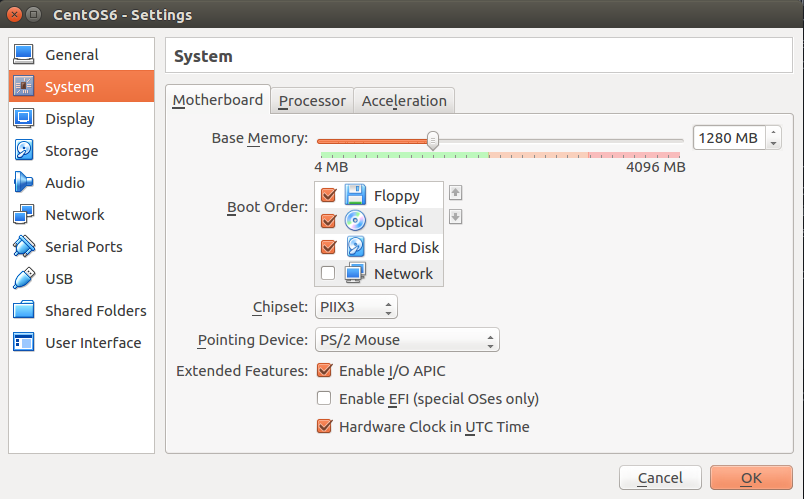 Figure 106-7 Re-order the boot devices.
On the storage menu change the optical disk to load the plop.iso image and only after you finish that ass you can boot the machine, It will bring you the plop menu which have nice tabs to choose what we need which is the USB drive.
If you done all right, after you choose and press on USB it load the syslinux menu like charm!
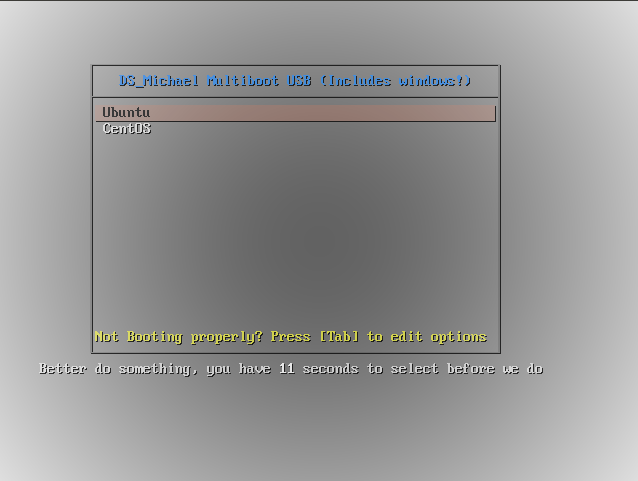 Figure 106-9 The SYSLINUX menu.
You can see that I have the option to choose the Ubuntu or CentOS operation system, just remember that the other boot loaders are pritty much the same, you need to format drive, prepare it, copy the relevent file, setup the menu for that boot loader and you ready to go.
If we talk about the PXE boot loader, have the option to boot from the network with the PXELINUX. This PXE work with protocols such as UDP/IP, DHCP and TFTP, on the server side we prepare the machine with the image file of our chosen distribution we want to install, setup the PXE and another files that related to the remote boot operation, on the client side we setup it to boot from the server and we specify that in the BIOS. more information
Challenge
- Upload to your chosen system, it can be any virtual system that contain only GRUB legacy.
- Change the run level for number 0 or 6 on the system.
- Try to bring up the system by changing the runlevel to the first runlevel again in the GRUB menu.
- do the same exercise on GRUB2 system.
1. Upload OS with GRUB legacy.
I am going to use my virtual machine that I show you before, please remember that I have two OS on that machine, the first is Ubuntu 9 with GRUB legacy and the second is Windows XP.
Right now that machine working fine and it load the GRUB and give me the option to choose what operation system I want to load up, so I load my Ubuntu and opened the terminal right after it load succesfully.
 Figure 107 Ubuntu 9 with terminal open.
2. Change the RUNLEVEL.
To check what is the current runlevel we need to type the command runlevel, in my case my Ubuntu on runlevel 2.
if you remember in Ubuntu we have argument for runlevel that are from 2-5 and they specified the multi-user mode like we saw in the man page for telinit, for changing the run level we can using telinit command.
I choose to use telinit 6 for changing the runlevel to 6 which will cause the system to reboot every time you load up the OS.
After I done so the system goes down and restart again, but it load the system and doesn’t restart again like it should do, so I check it again with runlevel command and I found that it on runlevel 2.
So now I need to find out how to change the runlevel permanently, for doing so I found out that there is some script that set the runlevel by using telinit on startup, that file is /etc/event.d/rc-default and I changed the last statement to run telinit 6 this should run for runlevel 6 permanently.
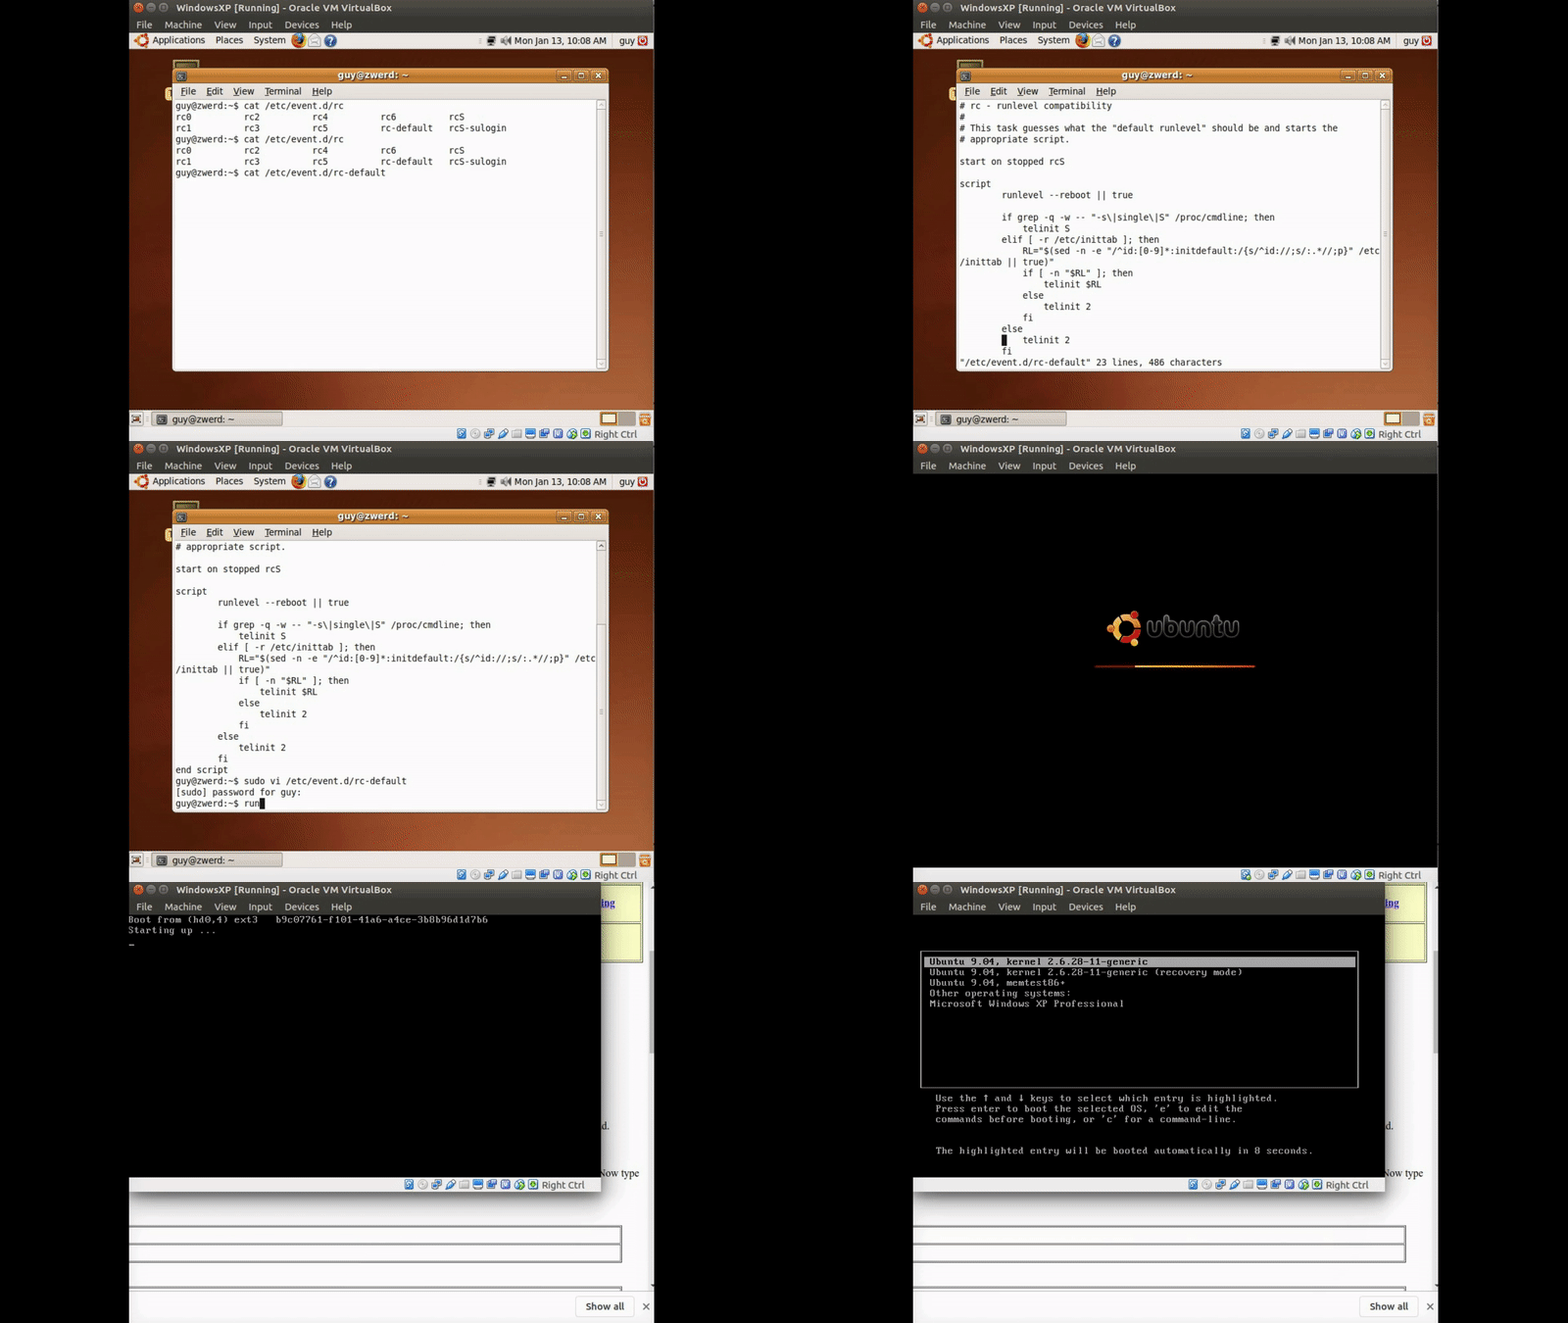 Figure 110 Changing the runlevel 2 to 6 which is reboot.
In the GIF image you can see that I change the rc-default file for telinit 6, this is the default script that run right after the system is bootup, so in that case it reboot itself again, this is cause for reboot loop that if someone that doesn’t have the knowledge in Linux, he won’t be able to bring the system up in that situation.
3. change back to runlevel 2 on the GRUB.
So far for now it’s problem because the changes we made make the system to be in reboot loop, we can solve it simply by made some changes in the GRUB menu, we just need to change the value quiet sptash on the kernel line to single which going to bring us single mode and we will be able to see it on the runlevel after we start up.
 Figure 111 Changing for single mode in the GRUB.
Now all I done is press enter and b for boot and the system give me the following menu.
After I choose the resume normal boot the system load up and I was able to run the terminal in my Ubuntu, I type runlevel and it echoed out S 2, but when I checked on the /etc/event.d/rc-default I saw that the lest telinit is still on 6 which is not good.
I change that file for telinit 2 and save it, after that I reboot the system and it load up again like charm.
4. Do the same on system with GRUB2.
I checked if I have some OS that contain GRUB2, I found that I have virtual machine with Ubuntu 18, the GRUB file in that system need to be at the following path /etc/default/GRUB, I load that system and didn’t see the GRUB2 menu, so I need to make changes in the GRUB file.
You can see that I comment out the GRUB_DEFAULT and GRUB_TIMEOUT_STYLE, and change the GRUB_TIMEOUT to value 10 instead of 0.
Now all I need to do is run update-GRUB, and I run it with sudo, now if I reboot the system it will bring me the GRUB menu.
Now we need to make the same issue we have done on Ubuntu 9, for that I am using systemctl which can help me to setup the default runlevel.
Now if I trying to restart the system it will be boot again in loop which is exactly what we needed.
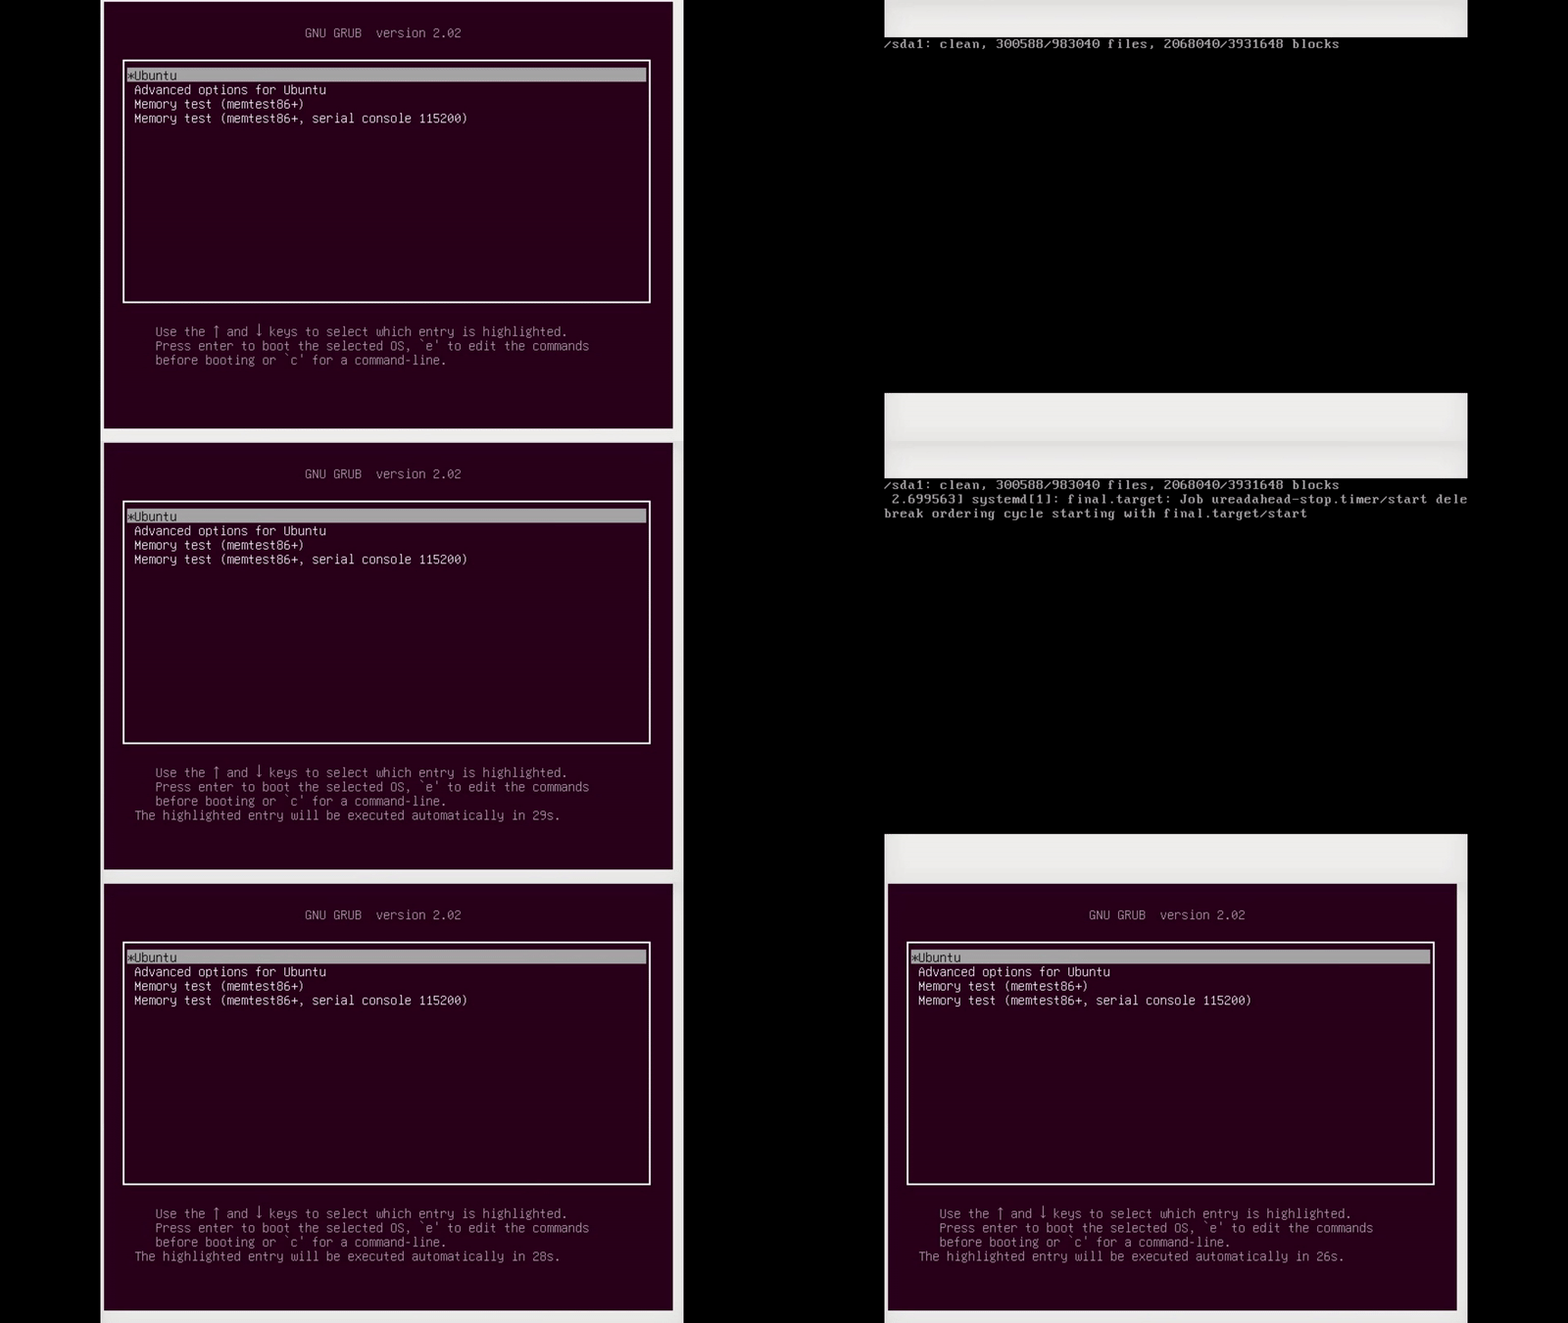 Figure 115 GRUB 2 on Ubuntu 18 in loop mode.
To solve it we need to get in the kernel line in the GRUB and change it. I found the quiet splash and remove it, I write 5 for runlevel 5 and press F10 for reboot and sure enough it boot up the OS GUI.
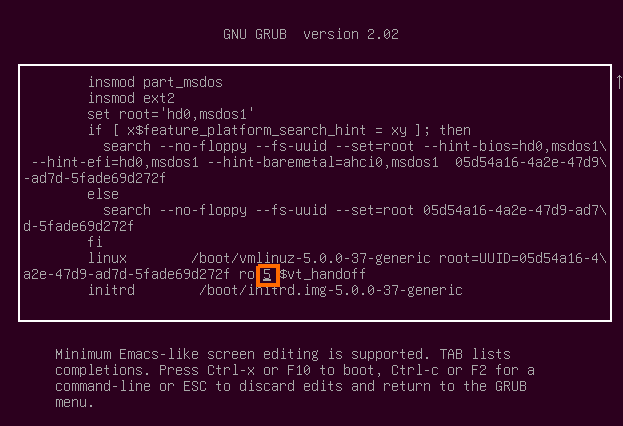 Figure 116 add runlevel5 in GRUB2.
Now all I have to do is to type systemctl set-default runlevel5.target and that’s it, if I try to reboot the system it will reboot without any problem like we had before.
 Figure 117 Changing to runlevel5 using systemctl.
Please note that I am using Ubuntu which more like Debian, if you use centOS you may use and change inittab file.
Please note: in the grub we have file named device.map that tell the grub the path to the filesystem partitions.
Chapter 3
Topic 203: Filesystem and Devices
When the Linux system is boot up, there is several thing that going on in the background, one of them is what we called mount, every device or storage we have connected to our PC will be mounted, in that way we will be able to use this device and view it’s content. In case we connect some USB device or other storage to our PC and we didn’t see the device, this may be because our Linux don’t know how to mount or how to read the device, so we need to know how to look on it and how to solve such an issues.
Every device we have on our PC and the system can see it, will be likely to list in the fstab file, this file can be found on /etc/fstab, in that file we will see every device that going to be mount.
In that file we can find several things, first is the device drive, in my case the following drive /dev/mapper/vg_centos-lv_root is mount on the root folder, the root folder as you should know is /, the type of that device filesystem is ext4. You should know that there is several type of filesystem, as example of ext2, ext3 and ext4, the different between those three is historically, basically on the ext2 filesystem there is no support of journaling, journaling is process that can help us to avoid errors in case there is a power outage, let’s say we start to saved some document we write and the power goes off, if the saveing dosn’t finish that data will be lost, the same is on our case, we write data to the disk and if the power goes off we may have some issue to read the data from that disk or alternatively we may be unavailable to read any data from the disk, there is several way to solved that issue (we will look on that as we foreword) but in the ext3 there is a jounaling that can solve that issue before it appear, the ext3 filesystem write some journal which is metadata that tracking down every access that done on the disk and in that way if the power outage was occur, he know exactly were it done and can repair that alone or by using fsck tool.
The ext4 filesystem is more advance then ext3, is support in really large file and there is more feature that we have on ext4, what we need to know is that we have more than one filesystem type, so in the figure 118 you can see that my root drive will use ext4 filesystem, the fourth entry can be use to allow the system run that drive on some group or some mode, in my case it is defaults which is mean according to mount man page that it’s support of the rw, suid, dev, exec, auto, nouser, and async options.
The fifth value mostly be zero, but I don’t really know why in my case it’s one, this stand for dump which mean to dump all the file on mounting process, but as much as I know this no used any more, the sixth entry is the mount max count, this is mean that if we unmount and mount again the disk up to the max value, on the next boot it will be check with the fsck for errors.
Please remember: if the sixty entry is 0 then it mean that this filesystem does not require fsck when being mounted to the system.
And this is all you need to know about the fstab file, we will look on that file more as we proceed, but I want you to know that there is more filesystem that I specified here:
1
2
3
4
5
6
ext2
ext3
ext4
btrfs
XFS
ZFS
You can see the all list on wikipedia, but this I think what we will look at in this chapter. If you want to look which drive use what type of filesystem, you can run the mount command. This command will bring you in live what devices we have mount, what is the filesystem type and were point it mount.
You need to knew that the same data that we can see with the mount command can be found on the mtab file, which stand for mount tab, this file contain the exact information we can view with the mount command, but there is other file on the /proc/mounts that can give you the same information also.
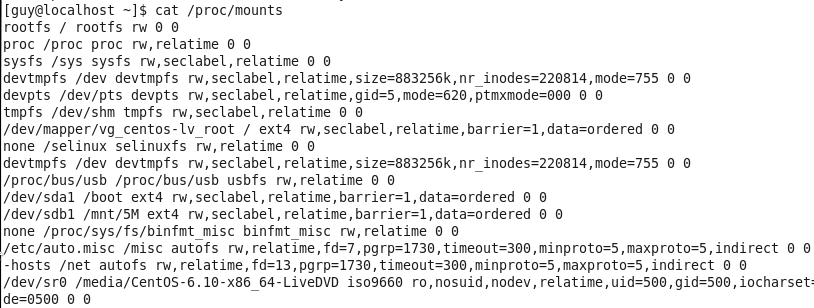 Figure 120 The mounts file on the proc folder.
The first element on the line is the mounted device, the second element is the mount point, the third element is the file system type, the fourth element lists mount flags (credit Fibrevillage)and the two last flag are as I specified with the details about the fstab file.
You can also see on the fstab that I have some UUID that point on the /boot folder, the UUID stand for Universally Unique IDentifier and will be consist of numbers and letters arbitrarily. If we want to add to fstab file some device and let’s say we want to add it be specify the UUID, so we can find that information by using the blkid command.
So you can find your device name and his UUID for use in the fstab file. Let’s say that your linux computer is working right now and you want to mount some drive you plug in, let’s say that the Linux can see that device but didn’t mount it, we can use the mount command for mount it or alternatively umount for unmount other device we want to plug out.
1
mount /dev/sdb1 /mnt/5M
In that case I specified the device location and the mount point which is /mnt/5M, of course, if you connect your USB you need to know what is the device location, if you don’t know you can use dmesg to see the last device you plug in, in my case it’s sdb and I created the sdb1 partition with fdisk, you may know that fdisk tool is learned in LPIC1 this is why I don’t elaborate about that tool.
By default, the Linux kernel writes data to disk asynchronously, this is mean that every data that we write is buffered (cached) in memory, in the optimal time your Linux will write the data to the disk, by optimal I mean when he have free memory that he can use then it will write the data down to the disk, if we want to synchronize that data immediately we can use sync command that will force synchronization to the disk.
We will use the sync command in case we anticipate the system to be unstable, or the storage device to become suddenly unavailable because let’s say you going to make some critical changes to your system. If you use just the sync command or sudo sync, it will sync all of your system, but you can also synchronize only one device as follow:
1
sudo sync /dev/sdb1
this will sync only the sdb1 partition in the sdb device.
If you remember we talk about the swap in that post earlier, and as you already know the swap is actually the memory that use directly from the disk, only when the RAM are full then the swap take an action, if we want to create swap by using the mkswap command, we have also the way to start that swap or disable it. The swapon command used for enable and start swap while swapoff used for disabling it, you also can check the fstab as we saw earlier to see the swap partition.
So let’s for example create swap space, what we can do is to make new partition on our disk by fdisk tool and find the UUID of that partition by using blkid command and specified that UUID on the fstab file with the type of swap.
We also can create swap file which work in the same way as partition, all we need to do is to create file by using dd command and named it swap.
1
2
3
4
5
6
sudo mkdir -v /var/cache/swap
cd /var/cache/swap
sudo dd if=/dev/zero of=swapfile bs=1k count=4M
sudo chmod 600 swapfile
sudo mkswap swapfile
sudo swapon swapfile
Please note: you can run all in one line as follow:
1
sudo dd if=/dev/zero of=swapfile bs=1k count=4M; sudo chmod 600 swapfile; sudo mkswap swapfile; sudo swapon swapfile
In that example we create folder named swap and in that folder we create zero file named swapfile with block size of 1K for 4M which mean that size of 4G, after that we convert that file for swap space by using mkswap, that last command is swapon for enable this swapfile to paging and swapping, we can verified that swap by running the swapon -s
Let’s say that you tried to to mount some disk and you get some error that say that you can’t mount that device because the system found that is damage or you just want to check that disk, in that case you can use fsck for error checking and repairing, in the fstab file section we talk about that in this file we have information of what is the MAX count of mounting the disk before it get checked in boot time, that fsck have the information in that fstab file what is the filesystem type for each device. If we want to to run that command alone we can use fsck as example:
1
fsck /dev/sdb1
This command will use fsck.filetype that available under linux and instead of filetype it should be the name of the filetype as example fsck.ext3. If you run this command and it’s say that the disk is clean so far so god! it’s meant it checked it successfully. If you can’t remember what is your filesystem type, just run blkid which give you the UUID as we saw earlier and the type of the filesystem, but usually you just need to run fsck and it work fine.
After you connect disk to your system and run fdisk tool to make partition on that disk, you need to make filesystem ready for use, to doing so you need to run mkfs with the specified filesystem type, as example:
1
mkfs.ext4 /dev/sdb1
This command will make the filesystem as ext4 type, only after that you will be able to run mount, in general you didn’t need to run mount with the -t option for filesystem type, but if it doesn’t work because let’s say this is msdos type, than you can use this option.
Before we mount the disk, let’s look at the dumpe2fs command output, this command can bring us a lot of information about the disk, but right know what we want to see is our superblock so I grep it out as follow:
 Figure 122 The dumpe2fs command.
You can see that the primary superblock start at 0, the first backup is start at 32768 and so on, so, if we have some damage disk we can run fsck to fix it, and for doing so we will need to know from what superblock to make the fix, so it will bring up the backup so the data on that disk will not lost which is good, but there is a problem, if the disk are damage we will never be able to see the blocks we have so we only can guess that number or we can run the following command:
1
mkfs.ext4 -n /dev/sdc1
We will use this command only if we know that the filesystem for that partition is ext4, if so that command with -n option wouldn’t create filesystem on the partition but it will run as if he would done it’s process on the disk, so in that case we will be able to see the blocks and use the numbers of the super block on the fsck for trying to fixing the filesystem.
After we connect the device to our Linux and we run fdisk successfully and created partition and we format the filesystem with mkfs and we mount the disk for file system point, we can find information about the disk more quickly by using tune2fs.
This tune2fs will bring us information such as the UUID, the mount point, filesystem features, mount time and even the MAX mount count we saw at the fstab file, you also be able to see how much time this disk was mounted, so if we set the MAX mount to be 5 mounts before the disk checking will done and we mount the disk 6 time, on the next boot up it will run fsck on that disk and the mount counter on tune2fs will be 0.
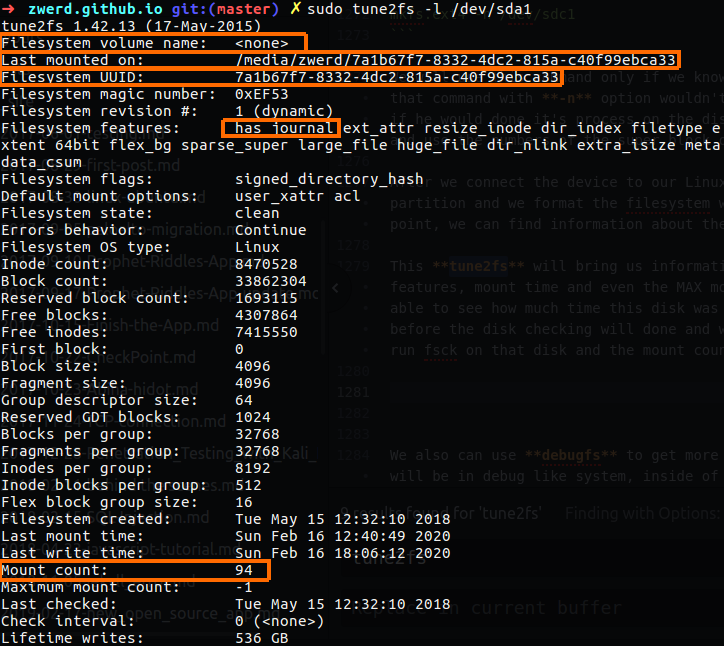 Figure 122-2 The tune2fs command.
You can see that we have lots of information, UUID, filesystem type, label that in my case is none because I didn’t setup any label name for that partition.
Please remember: we have many option we can use to edit value on the disk by using tune2fs, like the label name which can be edit by run the tune2fs -L root /dev/sda to setup on the disk.
Please remember: that the only differences between ext2 to ext3 or ext4 filesystems type is by the feathers we enable on the disk, for example if we have ext2 filesystem what we need to do is to add the uninit_bg, dir_index and has_journal feathers for change the ext2 to be ext4, we can achieve that by running tune2fs -O extents,uninit_bg,dir_index,has_journal /dev/sda1.
 Figure 122-3 The ext2 filesystem.
mount count, maximum mount count which is my case -1 because I didn’t set it on the fstab, if you remember in my case the pass (which is the max count mount) is set on 0 which mean it will never pass the fsck checking.
We also can use debugfs to get more information about the device, if we run that tool we will be in debug like system, inside of it if we type ls it will bring us more details then the normal ls done, we also can type lsdel which bring us all file in that device that was deleted, normally you wouldn’t to see anything becouse rm do greate job of deleting file.
We also can specified what is the superblock we want to read and what is the size of block with the following command:
1
debugfs -b 1024 -s 0 /dev/sdb1
The -b option stend for block size, the -s stand for superblock which in my case is 0, this is mean that I trying to read superblock 0 while the size is 1024 for block to read.
You can also run debugfs without parameters and you be able to debug the disk, in my case I just want to show you how can you check a specific superblock in the disk.
So far we talk about ext2, ext3 and ext4, we have more filesystem type like btrfs which is what I want to display now, this btrfs have more features then we have in ext4, like support in more large file zise like 16 EiB on disk, which is 2^64 byte which is really big, it also support RAID functionality, and snapshotting and more feature then we saw so far.
First of all let’s talk about the RAID functionality, we will view on the RAID in the next chapter also but the basic of it is that this RAID can help to do some backup or more likely to distribute the data on the drives which can be handy if one or more of the data is corrupted, because if one disk went done, you still have data that you can use on another disk, we will talk about that later on, but right know you need to know that btrfs support in RAID in such of thing that we can adding more disk to the system which we have RAID on it, I mean more devices can be added after the filesystem (which is btrfs) was created.
To make btrfs filesystem we can use the mkfs.btrfs command and we can run that command on multiple devices like as follow:
1
mkfs.btrfs /dev/sda /dev/sdb /dev/sdc /dev/sdd
If we want to use btrfs for run snapshotting on the disk before we will make some changes for the system, there is a simple way to make backup and that allow us to have the exact files on other folder.
At first we mount our btrfs to mount point which is in my case /mnt/btrfs.
1
mount -t btrfs /dev/sdb1 /mnt/btrfs
Now we need to create somewhat that called subvalume, which we can use for snapshotting as we proceed foreword.
1
2
3
btrfs subvalume create root
btrfs subvalume create home
btrfs subvalume create snapshot
After that if we run ls we will can see that folders that we created, now let’s say that we have many files on those folder and we want to snapshot that, so we can backup the files with the following command.
1
btrfs subvalume snapshot home ./snapshot/190320_snap
In this case I run snapshot for my home directory and that folder created under snapshot folder with the name 190330_snap which stand for 19.03.2020 snapshot, if I had some truble with the home directory I can use my 190320_snap and restore from that files as needed.
You have also more two command that can be use to delete subvalume or list of all your subvalume:
1
2
btrfs subvalume delete ./snapshot/190320_snap
btrfs subvalume list /mnt/btrfs
You can also find more information in the ramsdenj.com, but you may want to know how to specified the btrfs on the fstab file, because if you write at the option defaults or something else that we saw earlier in EXT this will not work, the option you need to write at fstab file is as follow:
1
/dev/sdb1  /mnt/btrfs    btrfs   rw,noatime,discard,ssd,space_cache    0 0
We can also convert ext3/4 filesystem to btrfs by using btrfs-convert tool.
Please remember that btrfs have it’s own way to check and repair error, you can’t use fsck tool for that kind of filesystem, and the same principle on the XFS filesystem, let’s format the sdb device for XFS and after that you can see that I tried to run fsck.
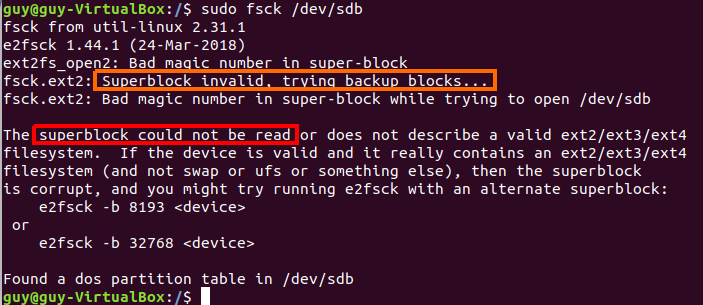 Figure 124 The xfs file system by using fsck.
You can see that it’s can’t read the superblock, so for make checking on XFS we will use the following:
1
xfs_repair -n /dev/sdb1
We also can use xfs_info for finding more information about that disk, this tool can give use information like bzise and block size, we also have the option to use xfs_check for checking whether the XFS filesystem is consistent.
You also need to be aware about SMART for the LPIC2 exam, SMART are stand for Self-Monitoring and Reporting Technology System, we have the smartctl and smartd, the first one are use for scan devices and print the information about them, the second one is a deamon that will attempt to enable SMARTmonitoring and polls these and SCSI devices every 30 minutes.
SMART are technology that build in the drive, so the smartctl and smartd are just tool that can be use to access that disk and bring a various log for us, but in case you drive didn’t support SMART those tools are useless for you, mostly the SMART can be found on ATA and SCSI drive, in case you have those drive you need to install the package that called smartmontools
1
sudo apt-get install smartmontools
If we use the smartctl we can check to see information about the disk by using the following command:
1
smartctl --test=short /dev/sda
This command will produce a short test on the disk, you have also a long one but let’s look on that one, this will tell you that the test is run and how much time it’s gonna take, mostly it tells you that you must wait 1 minutes for test to complete and it will run in the back ground.
After it finish it will bring you the data collection for the drive, like how much time the hard drive are power on, program failed count, Report Uncorrect for error that found on the disk and more information that can give us a clue what is the status of our disk.
We also have the file on the following directory /etc/default/smartmontools, on that file we can uncomment the the line who related to smartd start on boot time, if we uncomment that line, the check for the disk will run every time we will boot the PC, and if it will find any errors on the disk it will email us about the information it found.
1
start_smart=yes
To start the smartd we just need to run service smartmontools start which will bring up that deamon and this will run in the background and look for error or bad information that we need to be aware for.
There is more filesystem type that we need to know for the LPIC2 exam which is ZFS which was develop by Sum Microsystems, correctly only Ubuntu support that and offers kernel integration for ZFS. We have alot of command that can be use for ZFS type, such as zpool list -v which can show us the pools, the pools are the logical volume managment and can consist out of single or multiple disks. We can add for a one pool many disks so that can be handy in case of data recovery.
We also can see the status of the pool by running the follow up command:
1
sudo zpool status -v
Did you know that we have the option to mount disk manly from the network automatically by connect to that directory?
By using autofs we can do just that, we setup configuration of autofs and only when we trying to connect the nfs server directory, only than this directory will mount on our system and we will be able to see every file on that directory, what we need to achieve that is first of all install autofs and setup the configuration file, on the server side we need to make a shared folder for nfs technologies.
So, let’s start on the server side, I am running Ubuntu 18 on vbox. I need to install the following:
1
sudo apt install nfs-kernel-server
This command will install the nfs on my server, I will show you how to set the folder supporting the nfs as we will proceed, right now I need to allow users connections for nfs folders, for doing so I gonna setup my nfs folder and change the mode and setup permission .
1
2
3
mkdir /home/guy/files
chown nobody:nogroup /home/guy/files
chmod 777 /home/guy/files
So in my case the name of the folder that I am going to use it as my NFS share folder is files. Now we need to create export configuration for this folder, in this export we will specify the path to the NFS folders and the source IP client that will be able to connect to this folder.
1
sudo vi /etc/exports
 Figure 125 The exports file that contain the export folder.
As you can see I specified the path to that folder and set the source IP which be allow to connect that folder remotely, this is the IP of my client, you also can see that this folder is with rw permission and in sync state, please remember that the server IP in my case is 172.16.0.192.
Now, after we saved the exports file we need to run another command for enable our changes, and restart the nfs-kernel-server service.
1
2
sudo exportfs -arvf
sudo service nfs-kernel-server restart
And this is it, now we have server that allow the files folder to be export as nfs and allow to our client to connect it, so let’s start setup the autofs on our client.
First of all in my client I need to install the autofs
1
sudo apt install autofs
After that we can found that we have new files on etc folder which all of them contain configuration for automatically mount filesystem to our machine.
 Figure 126 The configuration file for autofs.
We interested in the auto.nfs file and auto.master file, the master file is the main configuration for our auto mount folders, so we need to setup on that file new line for our nfs folder, in my case I setup the following by using vim editor sudo vim /etc/auto.master:
1
/home/zwerd/nfs /etc/auto.nfs
The path to /home/zwerd/nfs is the mount point folder which it the files folder on my server. The configuration for mounting can be found on the /etc/auto.nfs file. If we go to the auto.nfs file we will find one line that setup the mount point as follow:
1
files 172.16.0.192:/home/guy/files
In that file we specified files which going to be the mount point under nfs folder in out system, that mount pointer point to my server which is 172.16.0.192 and contain the the path to the files folder on the server.
Now we need to restart the autofs service and after that we will be able to connect to files folder and see it’s content.
1
sudo service autofs restart
 Figure 127 Auto mount on my client.
Please remember: I specify the /etc/auto.nfs for my example, but you can setup that file with other name, as example /etc/auto.home for being the pointer file for /user/home, I mean that you can give the auto file what ever name you like and on that file you must specify the mount point on the server.
For the EXAM we need to know more thing like ISO files and encription. The original ISO 9660 is being around for a long time, in that format there was an issue that at first it didn’t support for long filename, so for support this the Joliet extension came alone which have a support for longer filenames, but Joliet doesn’t support in permission which mean that if we make some CD with this extension we can’t store the permissions on the disk, so for solve it the Rock Ridge can be use and allow us to use permissions on the CD, the last extension of ISO 9660 is El Torito which allow us to make a bootable disk.
Please remember that ISO 9660 is for CD’s only, the UDF (Universal Disk Format) can support in CD and also DVD. In Linux world we have an utilities that can help us to create iso file and burn that to the disk.
Let’s create our own CD dile image, so in my case I have the folder Jack and Jill (2011) that contain… Guess what… Jack and Jill of course which is Adam Sendler movie, and let’s say that I want to burn it to the disk, I can simply make an iso file by using the follow up command:
1
mkisofs -r -o jeck_and_jill.iso ./Downloads/Jack\ and\ Jill\ \(2011\)
In this command I use the option -r which tell it to use Rock Ridge and save the permission on the output file, the output file name gonna be jeck_and_jill.iso and the input is of course the path to the movie folder.
 Figure 128 My new iso file in my downloads folder.
If we need to make a bootable image we can use -b option, or if we want to burn ir to DVD file we can use the -udf option, in my case I haven’t manual page for this command but I can run mkisofs –help to see that options,
Let’s talk about encrypted drive, in case you want to make sure your data is safe, you can encrypt the device who contain the data, in that way if someone will steal your disk, you can be sure that the data itself are safe and encrypted, for that situation we can use cryptsetup.
This cryptsetup can be use on the drive we choose in order to encrypt that drive, we just need to run some of the command we saw before, I will run it quickly.
 Figure 129 You can see I have mounted drive.
I have mounted partition from my sdb drive which is sdb1, you can see that the filesystem type is XFS, now I need to run the following command:
1
sudo cryptsetup -v -y luksFormat /dev/sdb1
 Figure 130 cryptsetup encrypt my drive.
This command will ask for password and encrypt the all drive, the -v stand for verbose, -y stand for verified-pass which mean that by using that option it ask for password twice and if we miss typing he will alert it, by using that command the drive will be encrypted and now if we connect that divice again we need to run the following command to open it again.
1
sudo cryptsetup luksOpen /dev/sdb1 sdb1
 Figure 139 cryptsetup open my drive.
Now we just need to mount the drive and we can use it, every time we connect the drive even on the GUI like Ubuntu he will ask for password, it he dosn’t we can alwase use this open command for opening that drive.
Challenge 203-1
So it’s time to Challenge 203-1! I’m so excited!
- Format USB drive, connect it to virtual CentOS machine and prepare it to be type of ext4 filesystem.
- Set that new drive to be auto mount on client side.
- Set up for that drive password protected.
- Mount again the drive and try to use it on the client side.
So let’s look who to do those tasks
1. Add new drive and format it on CentOS.
So I start up my CentOS and check to see if it read the new drive, by using fdisk, you can see that I have new drive in sdb.
 Figure 140-1 Adding drive to my machine.
For prepare it to be use, I need to create new partition, I can run fdisk on that drive and create the primary partition.
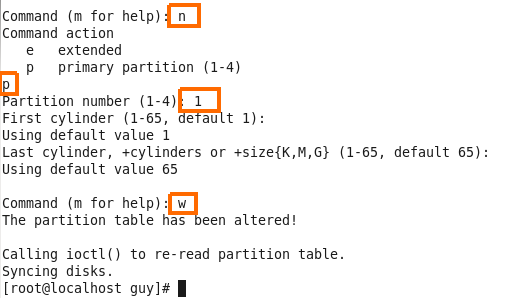 Figure 140-2 Creating partition.
New we need to check that we can see that partition by using fdisk again,
 Figure 140-3 List of my current drive.
So it’s time to make the drive by format it to the ext4 type by using mkfs.ext4 command.
Now that I have new drive ready I need to mount it.
So now I have mounted drive, so let’s proceed.
2. Setup the auto mount on the server and client.
So now I need to setup auto mounted on this server, let’s install the
1
yum install nfs-utils nfs-utils-lib
So now I need to create new folder with permission for any one.
 Figure 140-6 Using chmod and chown.
After that we need to make export setting for that folder, we can find the export on the etc.
1
2
3
#/etc/exportfs

/mnt/drive1/backup 192.168.43.145
After that we need to run the following command:
 Figure 140-7 You can see that the nfs is ready.
On the client side I going to create folder that will be used for my mount point.
1
mkdir /home/zwerd/drive1
Now I need to check in my auto.master the configuration.
1
/home/zwerd/drive1 /etc/auto.drive
Now for my folder drive1 on the client I need to set the auto.drive with the current path to that drive.
 Figure 140-8 Exact path to mount drive1.
Now it’s time to restart the autofs service.
1
sudo service autofs restart
So now I need to check if I see that on my mount output.
After that done I checked if I can connect to the “drive1” directory, but it didn’t work well, so what can I do is to trying mount that drive manually and check for error that can help us to find why is can’t be mounted automatically.
Let’s check if now I can mount the backup folder and use that.  Figure 140-10 Mount failed.
You can see that the mount is failed, as much as I know I done what needed in order to create NFS directory and use it with auto mount, so now I trying to run tcpdump on the centOS machine and after that I will try to mount the drive again and see what si going on.
So you can see the logs I have from my capture.
 Figure 140-11 My tcpdump capture.
As you can see my zwerd station trying to connect the CentOS via nfs but the CentOS server dosn’t replay for that request, at the same time there is an ICMP packets that specify that this port is unreachable - admin prohibited, this may mean that the service is not reached, but I activated the NFS on that machine so I don’t think that the service is not active, it may be blocked out by local firewall that I have on that machine, so I run the system-config-firewall command and view the firewall configuration in GUI mode.
 Figure 140-12 My firewall and nfs service.
So I allowed the nfs ports, and now it time to check if it working as expected.
 Figure 140-13 My CentOS file on my CentOS machine.
3. Create password protected on the mounted drive.
First of all I need to umount the drive and set it for password protected, I am using the following command:
1
sudo cryptsetup -v -y luksFormat /dev/sdb1
 Figure 140-14 Password protected on sdb1.
After it finish I need to run the following:
1
sudo cryptsetup luksOpen /dev/sdb1 sdb1
 Figure 140-15 Open the protected drive sdb1.
This command will open the drive in /dev/mapper/sdb1 - it will ask for the password we setup, only after that done I need run mkfs.ext4 /dev/mapper/sdb1 on the drive and prepare it to be use by the client.
4. Mount the drive again.
please remember that we have all auto mount settings so we need just to mount that drive to /mnt/drive1 and make the backup folder and on the client side to mount that.
 Figure 140-16 Mount the drive again on my Ubuntu system.
Now I can reboot the system and it should mount that directory automatically over NFS, so we finish the task.
Chapter 4
Topic 204: Advanced Storage Device Administration.
This objective includes using and configuring RAID 0, 1 and 5, so let’s start and talk about RAID. This RAID technology in the present help to make live backup every time we write data to the disk, this is mean that if one of the disks that the RAID setup on die, we have a backup on the others disk and the data will never being corrupted, this is a very cool staff, but you have to be aware of it that not all of the RAID perform such data saving.
RAID 0 is the first one and not contain any sort of backup, what we do with that RAID is to use RAID on top of two or more disk and every data that go down and save in with RAID0 it will save random data on random disks, so we have no much control over RAID 0 to save data when some of the disk found unreadable.
RAID 1 however have backup for every data you save on the disk, let’s say that we have two disk and on every disk we setup only one partition, after that we run RAID 1 a top on that and start to save data on the RAID 1, in that case every data are duplicated and save twice, one on the first disk and one on the second, in that way if disk one was corrupted we have full backup on disk two.
RAID 5 for me is more complicated to understand but I will try the best to explain it down, RAID 5 can only be used when we have 3 or more disk, on top of it we activate RAID 5 and the data can be save over these disks with plus data that called parity, this parity is the sum in XOR which mean the following:
1
2
3
4
0 xor 0 = 0
0 xor 1 = 1
1 xor 1 = 0
1 xor 0 = 1
So let’s say that we have three hard drive and on top of it we activate RAID 5, what actually gonna append is that the data is save on the disk as a packets, every packets can contain the same amount of bits, so let’s say that every packet contain 4 bit and we have data that we want to save that are is 8 bits, so the first packet (with 4 bits) are save on disk one, the second packet save on disk two, on the disk three the RAID calculate the XOR sum of each of the data we daved, so in that case if one of the disk goes down, we still have half of the data and we can use the parity to calculate the lost data.
You can see visual example under that link, after you have the knowledge of how RAID 0, 1 and 5 works we can start to setup it on our virtual machine.
Let’s create RAID by using our disk, in my case I have two disks that I can use /dev/sdd and /dev/sde each is in side of 4M, first of all we check the following file to know if we have any RAID on the system:
1
cat /proc/mdstat
 Figure 140 RAID status in mdstat file.
If we have some RAID it will be list in that file, now we need to run fdisk in order to prepare our disks for RAID use, so we run the following command:
1
sudo fdisk /dev/sdd
At first we will going to create partition by using the n option and we proceed all of the queries it jump on the screen, after we finish we need to change the partition from Linux to support RAID.
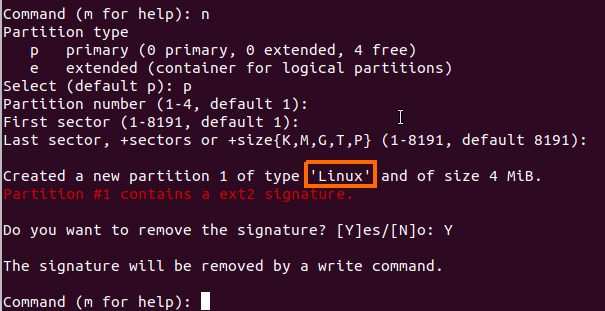 Figure 141 Create new primary partition.
In my case you can see that I have some error, this is because my old partition on that disk was with ext2 filesystem so this is why you see this signature. Now we need to change this to support RAID, we need to know the code number for that so we can use l option.
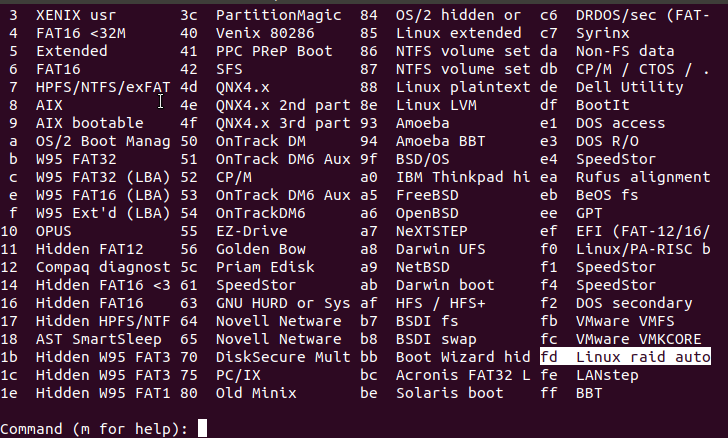 Figure 142 list the option we have with fdisk.
You can see that the type for RAID is fd, so we need to insert t to change the type of the partition and after that type fd to choose the RAID and now we need to do is to save that changes, we need also do the same for /dev/sde.
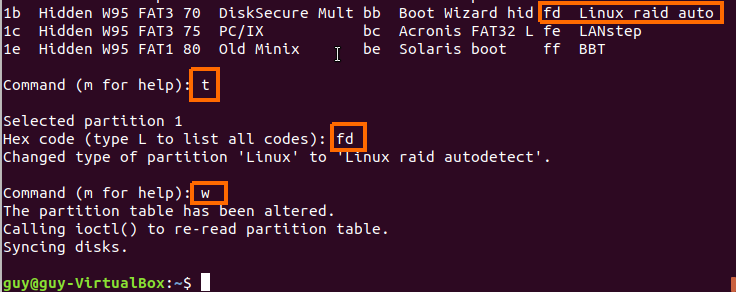 Figure 143 Save the configuration we done.
After we finish to setup both of the disks, we will find these new partition by using ls over dev and we will find that we have sdd1 and sde1.
We need also to run mdadm tool for setup the RAID drive, in this command we also need to specify what RIAD level is gonna be, 0, 1 or 5 so you can run the following:
1
mdadm --create --verbose /dev/md0 --level=1 --raid-devices=2 /dev/sdd1 /dev/sde1
In this command we create new RAID so this is why we use –create option, we also want to see more output so we using –verbose option, after that we choose the device name, please note that this command go and create the md0 for us, we also choose the level 1 which is RAID 1, but please remember that if you choose RAID level 5 you need to choose at least three devices, the next option is –raid-devices=2 which let the mdadm to use two devices in that RAID.
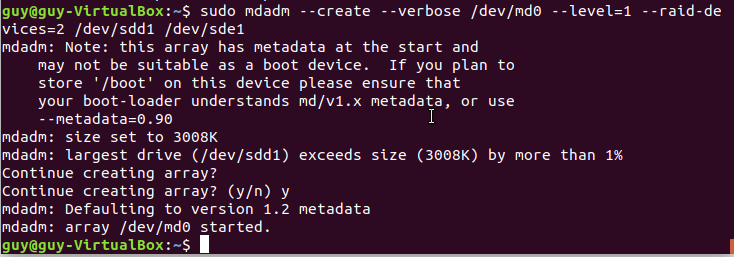 Figure 145 Using mdadm command with super-user.
After that the md0 will created and now we need just to mount that normally and start to use it, so first of all we use mkfs.ext4 for setup the filesystem type and after that mount as ext4 to some new folder, in my case this is the RAID folder under /mnt directory.
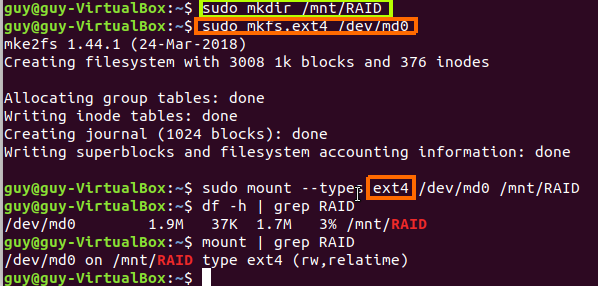 Figure 146 Mount the md0 to RAID folder.
And this is it, we can use it and write data to it normally like as we use one device, we can now to run mdadm to check details and bring it to another file configuration for every boot time our system contain the RAID by default (exactly what we done by using fstab).
 Figure 147 The details of all our RAID on the system.
This information need to be save on /etc/mdadm.conf file and this will make the system to load the RAID for us by default.
1
mdadm --detail --scan > /etc/mdadm.conf
Please note: we also can run test on our RAID’s to simulate failed device within a RAID 5 array:
1
mdadm --fail /dev/md0 /dev/sdc1
In that case we specify the sdc1 to mark as fail, this will cause the RAID5 to do the action he would done if the disk was really damage. Using the –set-faulty would done the same operation.
Now I want to talk about the hard disk, we saw so far the hard disk, memory, cpu and such on chapter 0 but now we need to have more knowledge about that so let’s dive in. On the LPIC2 it’s say that we need to know about the DMA, this is short for Direct Memory Access and it’s can be use to help to improve performance over the PC, in the computer we have hard disk, memory, and processor, in the not so far past when we want to load data from the hard disk to the memory the processor start to run and load the data from the disk to the memory, in that case every action that we done on our computer would take a long time because the processor was busy, let’s take for example case that we want burn data to our optical disk, in that case the processor need to take data from the hard disk, load it to memory and use it to burn it down, this would take a 20 minutes to finish to burn just one file in size of 600M, which is very frustrating, consider that in our days everything works fast, so to solve it there is a very simple solution, we need to find a way to leave the processor out of the picture, so the DMA came alone and it allow direct access from the disk to the memory without needed to use the processor, so if your PC are slow we may want to check if the DMA functionality are enable on your PC.
for doing just that we need to use hdparm, this tool can give us information about the IDE drive, which one of them is if the DMA are active or not and it also can give us information of performance to check the buffer reading or disk reading in seconds.
1
sudo hdparm -t /dev/sda6
The option -t is used for perform device read timings and with that data we can know how much speed it takes to read data from the disk and how much data in short amount of time, this command print out the following line:
1
2
3

/dev/sda6:
 Timing buffered disk reads: 424 MB in  3.00 seconds = 141.20 MB/sec
You can see that 424 MB was read from the disk in timing of 3 second with is very fast, we also can use the -T option which perform cache read timings which is the memory, so this should be faster then the disk reading by using the following command:
1
sudo hdparm -T /dev/sda6
In my case the output was as follow:
1
2
/dev/sda6:
 Timing cached reads:   7568 MB in  2.00 seconds = 3790.49 MB/sec
You can see clearly that he read more data from my cached in very short time then we done on the disk. let’s say that you run the buffer disk check and it print out the following line:
1
Timing buffered disk reads:    8 MB in  3.16 seconds =   2.53 MB/sec
This is mean that we have some problem here, so what can we do is to run the following command:
1
sudo hdparm -i /dev/sda6
This command will print out some information about the disk, module, buffertype and also DMA, in my case this is what it print out for me:
1
2
3
4
5
6
7
8
9
10
11
12
13
14
15
16
/dev/sda6:

 Model=SAMSUNG MZ7TE256HMHP-00000, FwRev=EXT0100Q, SerialNo=S1FENSAG301277
 Config={ Fixed }
 RawCHS=16383/16/63, TrkSize=0, SectSize=0, ECCbytes=0
 BuffType=unknown, BuffSize=unknown, MaxMultSect=16, MultSect=16
 CurCHS=16383/16/63, CurSects=16514064, LBA=yes, LBAsects=500118192
 IORDY=on/off, tPIO={min:120,w/IORDY:120}, tDMA={min:120,rec:120}
 PIO modes:  pio0 pio1 pio2 pio3 pio4
 DMA modes:  mdma0 mdma1 mdma2
 UDMA modes: udma0 udma1 udma2 udma3 udma4 udma5 *udma6
 AdvancedPM=no WriteCache=enabled
 Drive conforms to: unknown:  ATA/ATAPI-2,3,4,5,6,7

 * signifies the current active mode
You can see the under UDMA modes there is an asterisk next to the udma6, UDMA is an Ultra DMA which is fster then the normal DMA, you can find more information about the modes in that link and how faster every mode from the previous one.
So in my case the UDMA is active and this is why every thing work better and fast, but if in your case the DMA is not in active mode then you need to run the following command:
1
sudo hdparm -d 1 /dev/sda6
In my case if I trying to run this command it print me the following error:
1
2
/dev/sda6:
 HDIO_GET_DMA failed: Inappropriate ioctl for device
This is because I am using virtual machine, so this is why it not working for me, in my case I need to run other command and we will get to it shortly. So if you have IDE you need to use those command, if you want to make it to be enable automatically on boot time you need to setup in on the /etc/hdparm.conf file with the following configuration:
1
2
3
/dev/hdc {
dma = on
}
In hdparm you also have an option for specific device, like -H which will be use for Hitachi only to read temperature from drive, and also -J for Western DIgital drive, please remember that if you using hdparm on virtual machine it not gonna work because it is virtual, this tool is for hard drive.
The sdparm utility is the same as hdparm but it used for accesses SCSI mode page. We may want to change some parm of the device, like /proc/interrupts which will give us information about the device interrupt value that be use to interact with the kernel.
I want to clarify more about the IDE and ATA, PATA, SATA, this all are the same, they equally the same principles of ATA, what I understand so far that every one of them is like advance version of ATA. Also every one of them have connector that they oprate, like in RJ-45 that operate by ethernet, I don’t know if it the same principle, but we have SATA for example and we also have SATA connector, the SATA operate the connector.
SCSI is other world of connectors and other then the PATA or SATA operator, it work better with SSD, as much as I understand (you can leave here a comment if you think I am wrong) we have two type of disk, the first one is HDD which stand for Hard Disk Drive, it is an magnetic drive with metal arm that read and write data from the disk and to the disk, it most likely that you found on that kind of disk PATA port.
There is a difference between PATA and SATA ports.
And you may find hdd with SATA port.
 Figure 150 HDD and it’s SATA ports.
Please note that SATA have it’s own cable and serial port that is different from the PATA.
The SSD is different from HDD, it stand for Solid State Disk and it support very high performance, it more likely to find SSD with SATA port, but I also found that there is a SSD that came with PATA connector.
 Figure 152 SDD with SATA port.
Please note: if you have HDD drive it will be specify as hd* in the /dev/ directory, the sd* stand for SSD drive and CD writer will sign as sr* which stand for CD-ROM.
It’s more likely that you found SSD card with PCI connectors like as in the following image:
 Figure 153 SDD with PCI Express.
This PCI express slot can be found on the mother board.
 Figure 154 PCI Express bus on the mother board.
There is also NVM Express, is a specification for accessing SSD attached through the PCI Express bus, the driver for NVM driver are include in kernel version 3.3 and higher, NVMe devices can be found under */dev/nvme**.
So far we talk about the disk we can have on our computer, let’s now talk about the way we can make some changes about the filesystem on the disk. If you remember we get to know the tune2fs tool which can be use to see the disk or more likely the partition on the disk by using the -l option, we can also enable journaling on the partition with tune2fs by using the -j option.
1
tune2fs -j /dev/sda6
We can also run option that related to the hard disk like -s for sparse-super-flag, this option allow us to enable or disable the superblock, it is the same super block we saw by typing the following command:
1
sudo dumpe2fs /dev/sda6 | grep super
This will print me out thefollowing:
1
2
3
4
5
6
7
8
9
10
11
12
13
14
15
16
17
dumpe2fs 1.42.13 (17-May-2015)
Filesystem features:      has_journal ext_attr resize_inode dir_index filetype needs_recovery extent flex_bg sparse_super large_file huge_file uninit_bg dir_nlink extra_isize
  Primary superblock at 0, Group descriptors at 1-7
  Backup superblock at 32768, Group descriptors at 32769-32775
  Backup superblock at 98304, Group descriptors at 98305-98311
  Backup superblock at 163840, Group descriptors at 163841-163847
  Backup superblock at 229376, Group descriptors at 229377-229383
  Backup superblock at 294912, Group descriptors at 294913-294919
  Backup superblock at 819200, Group descriptors at 819201-819207
  Backup superblock at 884736, Group descriptors at 884737-884743
  Backup superblock at 1605632, Group descriptors at 1605633-1605639
  Backup superblock at 2654208, Group descriptors at 2654209-2654215
  Backup superblock at 4096000, Group descriptors at 4096001-4096007
  Backup superblock at 7962624, Group descriptors at 7962625-7962631
  Backup superblock at 11239424, Group descriptors at 11239425-11239431
  Backup superblock at 20480000, Group descriptors at 20480001-20480007
  Backup superblock at 23887872, Group descriptors at 23887873-23887879
As you can see this is a backup superblock, but let’s say that we didn’t need so many backup super block, we can change it by using the -s of tune2fs tool for enabling it or disabling by using 0 or 1, which 1 tell him to enable and 0 is disable.
1
tune2fs -s 1 /dev/sda6
This is one of the options that tune2fs can do related to the hard drive, we also can use sysctl, this tool we saw on chapter 0 if you remember and it can help us to display all the current setting on the kernel.
1
sysctl -a
This command will show us the all setting we have on the kernel, they store in the /proc folder which we can use cat for look on them like in the /proc/interrupts, in this file we view the interrupts on the CPU
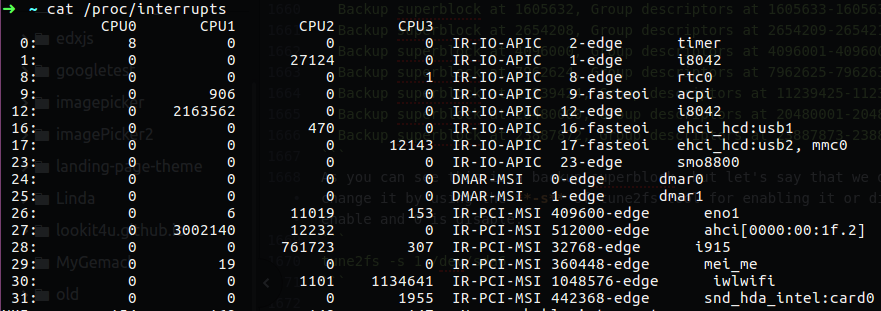 Figure 155 The details of interrupts on our CPU.
For change setting we use sysctl, we can enable or disable one drive or enother that related to the kernel and it is important to know all of that for the LPIC2 exam, just remember that this is the way that we can maniplate thing on the kernel that related to the hardware of our computer.
Please note: to set the value for a kernel parameter we can also use sysctl, but using the -w option and followed by the parameter’s name, the equal sign, and the desired value. For example sysctl -w maxcpus=1 this command will set the kernel to use only one CPU on that system. We can also echo it out to the following file echo 1 > /proc/sys/kernel/maxcpus and this will bring up the same operation.
There is one thing you also need to know, it is the fstrim which is use to discard unused blocks on a mounted filesystem, I saw many videos about that on youtube and all of them say that this is can be allow better performance on your system.
You can write the word discard (or “trim”) in the fstab file to allow it automatically mount and perform fstrim, but please note that in the man page is say that running fstrim frequently, or even using mount -o discard, might negatively affect the lifetime of poor-quality SSD devices.
So far we talk about hard disk and optical disk with PATA or SATA technologies, we need to have also knowledge about SCSI and iSCSI, when we talk about SCSI it can be sort of hard drive or optical drive or even floppy drive, but it also can referred to bus connector, but it also can be referred as the software technology that know how to connect with the hard disk, if you want to know more about that you can view the Ancient Electronics video overview which I found the most explainable for us to be ready for the EXAM.
In the LPIC2 objective we need to have more knowledge about iSCSI which is the way to mount SCSI device from the network, in iSCSI there is a two thing we need to know, the server side configuration and the client side configuration, on the server we need to setup the device that going to be use with iSCSI on remote machine which are the client, we also need to enable on the server it’s IP address and password if we want.
On the server side with setup the target which going to be some local disk on the server and on the client we use it as a initiator which going to mount the target from the remote server.
I am going to use centOS 6 for server side which is my target and I will use ubuntu 18 as client which is the initiator.
In my server I need to install the following utile:
1
sudo yum -y install scsi-target-utils
After it finish we need to setup the target so in my case I need to use the following configuration file:
1
vi /etc/tgt/targets.conf
On the bottom we need to write the following:
1
2
3
4
<target 172.16.0.209:target01>
backing-store /dev/sdb1
incominguser admin admin
</target>
With this setting I make single entry which mean it’s going to have one drive storage that the client (initiator) can be use for mounting it, my backing storage is sdb1 and the username is admin password admin for initiate.
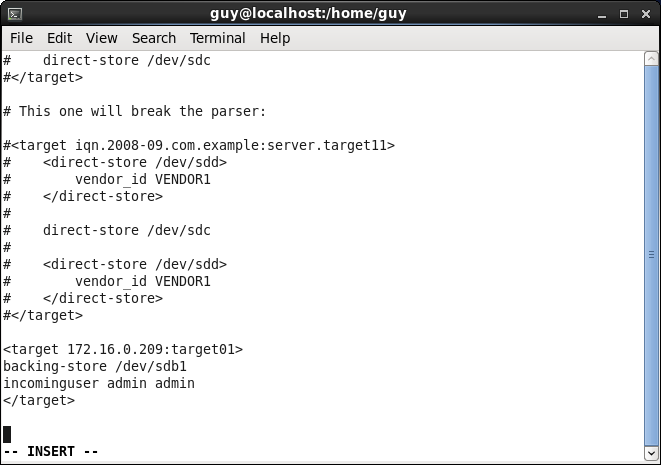 Figure 156 The target file configuration.
Now we need to restart the tgt service
 Figure 157 Restart tgtd service.
Now we can use the tgtadm command for view our configuration by using the following option:
1
tgtadm --mode target --op show
In this command we specify the mode which in our case is target becouse we setup the target file, and the operation is show for display it.
You can see that we have LUN0 for the controller and LUN1 for the disk and it contain the backing store path which is what we mount on the client, the initiator.
Now on the client or the initiator we can use the user admin with password admin to mount that device, but it will never work well because the centOS using Firewall by default, so we need to allow the connection for that server using port 3260 which is the port for iSCSI protocol that base on TCP connection.
1
firewall-cmd --zone=public --add-port=3260/tcp --permanent
Using this command the connection to that server will be able to establish, so now we need to run the following command for apply our settings:
1
firewall-cmd --reload
In my case I am using centOS6 so I need to run iptable because I haven’t firewalld on that system.
1
iptables -I INPUT 1 -p tcp --dport 3260 -j ACCEPT
Now we need to work on our initiator which is our client for it to be able to mount that SCSI device, in my case my client are Ubuntu based so I need to install the iSCSI software to be able to setup the initiator.
1
sudo apt install open-iscsi
After that we need to edit the following file /etc/iscsi/iscsid.conf, we not need to change much of that file, what we want to change is the node session for username and password because we set it on our server.
 Figure 159 Setup for the initiator.
Now we need to restart the iscsi deamon for making sure our setting applied.
1
2
service iscsid stop
service iscsid start
And now we can use the iscsiadm command for discovery the target.
1
iscsiadm --mode discovery -t sendtargets --portal 172.16.0.209
In this command we trying to discover our targets by specifying the IP address for our server, this likely to find the LUN1 we saw earlier and only after he will try to use the username and password we set on the iscsid.conf file, it will be able to see that LUN.
 Figure 160 Discovery of LUN on the target by using iscsiadm.
You can see that it find the target01 on the server, now if I run ls for check the device I have I will see the normal devices and the new device will not be one of them.
Now we need to do one more thing that will allow us to mount the remote SCSI drive, we going to use the target we found by using the following command:
1
iscsiadm --mode node --targetname 172.16.0.209:target01 --portal 172.16.0.209 --login
With this command will bring us the LUM to live on our machine as a SCSI device, and only after that we will be able to format the systemfile and mount it notmally on our system.
 Figure 162 Bring the target device on our client machine.
After that if we will run ls agian we will be able to see our new device.
 Figure 163 You can see the sdh drive.
We can find imformation about the drive in the following directory:
1
cd /dev/disk/by-id
You can find this folder aliases file that contian on thire names the drive on the system, for every device you can find the WWID (World Wide Identify) number or World Wide Number or UUID, on the scsi we see the WWN which is the drive uniq number.
Now we going to format it’s filesystem by using mkfs.ext4 and mount that after we finish by running mount and we be able to use that disk like it was local drive on our system, except if we have some network issue we may not be able to connect that drive.
We also need to know about LVM for the exam, in the LVM we need to know first three things, physical volumes, volume groups and logical volumes.
The physical volumes is actually the hard drives we have on the machine, lets say we have three hard disk storage that they all specify under /dev/sd* let’s say sda, sdb, sdc, the physical volume is the partitions on our machine, so we need to create for every device partition by running fdisk and use it for physical volume.
The volume groups are the group we create to make one group that contain many physical volume, so in our case the sda1, sdb1 and sdc1 each is physical volume, we can create one volume groups that will contain these physical volume.
The logical volumes is sort of logical partition, which mean that we can create from the volume groups many logical volumes and set up for them specific size on each volume.
Let’s say that we use sda1, sdb1 and sdc1 for each to be physical volume and we group all together for volume groups and from that group we setup many partitions as logical volumes, this implementation have advance abilities like to have the ability to resize the logical volumes and add more memory space for that, or to shrink it down, we can also have multiple partition for separate the data between them.
This is not like RIAD, because lvm have not backup data, we can use RAID under LVM, and on top of it to run LVM. The LVM also have the way to run snapshot.
For installing LVM we need to run the following on Ubuntu system:
1
sudo apt-get install lvm2
First of all I going to use fdisk to create the partition, I am not going to use mkfs after I done, instead I am using fdisk type option to choose LVM.
After that we can start to build our LVM over our disks, at first we need to create physical volume, we have command like pvdisplay that will show us the volume we have, since we have none, we going to create some:
1
sudo pvcreate /dev/sdc1 /dev/sdd1
In this command we specified the partition that will be physical volume each, only after that we can use physical volume to display our volumes.
You can see the PV name with on every physical volume is the device name, we can now use that volume on the volume group, you can see that every volume have size of 10G which is good for me.
Now let’s use the vgcreate command for create our volume group, we can run the following:
1
sudo vgcreate vg1 /dev/sdc1 /dev/sdd1
The name of our volume group going to be vg1 and I am using the actual path to the devices I want it to be in this group, after that I can run the vgdisplay command.
As you can see the name of my VG is vg1 and the format for this is lvm2, also we can see the VG size which is 19.99GB, just remember that we use two disk each is 10GB.
Please note: you can remove physical volume from volume group by using the vgreduce command, and also add physical volume by using vgextend.
now we can proceed to the logical volume creation.
1
sudo lvcreate --name lv1 --size 1G vg1
The name in my case is lv1, the size I am going to use is just ! giga, and the name of the volume group to use for that space location is vg1, you can see the details on lvdisplay command.
You can see the logical name and the volume group it is belongs to him, you can also see the path name which we going to use, now we can run mkfs and mkdir to create the folder which we using as mount point and also mount it, you can see the mounting name which is mapping that LVM.
 Figure 167 Mount the lv1 to folder1.
So as you can see every command we saw was start in one of the following options: pv,vg,lv.
We have more command that related to LVM in this type of naming, we also have the lvm.conf file that contain the configuration for LVM.
We can run backup of logical volume with the following command:
1
lvcreate -L 500M -s -n backupname /dev/vg1/lv1
In this command we specify the backup logical volume size by using -L for 500M, the -s option is for snapshot and -n for the name of that backup, after that we need to specify the logical volume we want to backup, only then when we type lvdisplay it will show us the backup volume we created.
 Figure 167-1 Backup logical volume.
You can see the backup volume I have now on my system.
Please note: we have no such command like lvbackup or lvshanshot, we just use lvcreate with the -s option for snapshot, if you what to see the all command thaty related for logical volume you can just run the ls /sbin/lv* this will display all lv command we can use.
 Figure 167-2 Commands for logical volume.
Challenge 204-1
So now the challenge going to be complicated, we going to use most of what we saw on that chapter.
- Setup server with 6 SCSI disk each in size of 512MB
- Setup RAID 5 on these 6 disk and create two dm volume.
- Use the two dm for create one virtual group and create three logical volume partitions, check the size of each.
- Create iSCSI target and initiator by using the LVM’s and mount it on the client, 1 storage as Documents, storage 2 as Programs, storage 3 as Public.
- Check the size of the mounted devices
1. Setup server with 6 SCSI disks.
I have virtual machine with CentOS system, so this is my server, I added to that server 6 virtual disk which each 512MB, now I need to set each disk, first I run fdisk on sdb for creating the first partition on that disk.
 Figure 168-1 Create partition by using fdisk.
Now we need to do the same for every disk we have or we can just use sfdisk for doing all at the same time (fdisk-multiple-disks-in-linux)[https://ittopix.wordpress.com/2016/05/31/fdisk-multiple-disks-in-linux/].
2. setup RAID 5 on each disk.
For setup RAID I need to change the partition type so by using fdisk I can chose t option and fd for RAID, after that done I check with fdisk the type of that partition.
 Figure 168-2 My new RAID partition.
Now I need to do the same on my sdc and sdd for making tham ready for RAID 5.
 Figure 168-3 Three RAID partitons.
After we done to setup the partition for supporting RAID, we need to create the RAID my using mdadm command:
1
mdadm --create --verbose /dev/md1 --level=5 --raid-devices=3 /dev/sdc1 /dev/sdd1
 Figure 168-4 Create RAID 5 with three partitions.
Now we can see the details of that RAID by using the following:
1
mdadm --detail /dev/md1
And also we can extract out the UUID by using --scan option.
 Figure 168-5 The details of our RAID.
Now I need to do the same with the others three disks I have on that machine and create RAID 5 which I am going to call it md2.
 Figure 168-6 The details of our RAID.
Please note that in my case md1 is contain the /dev/sdb1 /dev/sdc1 /dev/sdd1 and md2 contain the /dev/sde1 /dev/sdf1 /dev/sda1.
 Figure 168-7 My RAID groups are ready to use.
3. Create three logical volume each with size of 1GB
So now I need to use these two RAID’s and create the LVM, I can doing so by proceed with the three step of the VLM creation, the first one is using the pvcreate command, this will create physical volume so we can use that to create the volume group.
 Figure 168-8 The creation of the physical group.
You can see that I use the pvs command which can show us the size of it, but you can also use the pvdisplay that give you more data, now I need to create the group and that will help us to create the logical volume we need.
You can see that I use both md’s to create one volume group, we can use the vgs command and also the pvdisplay or vgdisplay to see that vg1 group setup on both of the RAID storage.
 Figure 168-10 Display my group.
Now it’s time to create the logical volume out of the group we have, as you saw the size of the whole group is 1.99GB so you may ask how it can be we use three 6 disks which every one of them is 512G so we need to have at least 3GB free to use, so the answer is that the RAID use for each of md’s storage 512MB as the dev size, so we laft with 1GB for each of md’s storage and the programe that create the PV or VG is also take a place so we left with 1.99GB to use before we going to create the LV.
So in my case I create every logical volume with 512MB by runing the following command:
1
lvcreate --name lv1 --size 512MB vg1
 Figure 168-11 My logical volume with the size of it.
Now I need to create more two logical volume with different names.
 Figure 168-11 My logical volume with the size of it.
4. Setup the iscsi devices on the client.
So now I need to install the target package, I don’t shore what is the correct name so I can use the following:
1
rpm -ra | grep scsi
This will give me the name of the package so I can use it to install it.
1
yum install scsi-target-utils
Now it’s time to setup the target, I need to make changes in the targets.conf file as follow:
1
2
3
4
<target 172.16.0.104:target01>
backing-store /dev/vg1/lv1
incominguser guy zwerd1234
</target>
 Figure 168-11 My targets on the targets.conf file.
Please note the directory for the logical volume’s and the IP address which is the server address, so now we need to restart the service.
1
2
service tgtd stop
service tgtd start
To verify that all setup correctly we can use the following:
1
tgtadm --mode target --op show
 Figure 168-12 You can see the three targets.
We also need to allow communication to the iSCSI port which is 3260 so we can use iptable to allow such connections:
1
iptables -I INPUT 1 -p tcp --dport 3260 -j ACCEPT
Now I need to setup the username and password in the /etc/iscsi/iscsid.conf file which we going to use to initicate the connection to the target.
 Figure 168-13 Addin the auth on the file.
Now restart the service:
1
2
service iscsid stop
service iscsid start
And tring to initiate the connection to the targets
1
iscsiadm --mode discovery -t sendtargets --portal 172.16.0.204
 Figure 168-14 You can see that it find the targets.
So now we need to use every target and initiate the connection, we will see the we have more scsi drive on the client machine.
1
2
3
iscsiadm --mode node --targetname 172.16.0.104:target01 --portal 172.16.0.104 --login
iscsiadm --mode node --targetname 172.16.0.104:target02 --portal 172.16.0.104 --login
iscsiadm --mode node --targetname 172.16.0.104:target03 --portal 172.16.0.104 --login
 Figure 168-15 Initiate the targets on the clients.
You can see that it successfully added the targets on the client machine, so now we can see if we have more drive on the client.
In my case when I checked the dev directory on my client I didn’t found the new drive, and on that day I work on my PC very late to find the issue, but I didn’t, so I start to check it again day after, then I find that in my CentOS on the targets.conf I setup the target with backing-stor without e, so I change it to backing-store and on my clent I run again the discovery.
Than I had the error no portal on the target so I run the following command:
1
tgtadm --lld iscsi --op bind --mode target --tid 1 -I ALL
After that I tried to run discovery again and it worked!
My dev directory before I run the iscsi was contain the following
 Figure 168-16 My dev directory.
After that I find that I have more devices that I can use.
 Figure 168-17 My dev directory again.
So now I need to mount all of those devices.
 Figure 168-18 You can see that all drives are mounted.
Please remember that I used fdisk to make partition and mkfs.ext4 for making filesystem type of ext4.
5. Check the size of each disk.
So I use df -h for find the size of each disk.
You can see that the size is less than 500MB, so you need to remember, every time you plan to add disk and use sort of technology which can be RAID or LVM or other technology, every such use part of the size you have on the disk, so you mush take it as count becouse if you need more large device at the first stage you mush bring more large disk that can give you the space you want to be allow to use.
Chapter 5
Topic 205: Network Configuration.
I have to admit that networking in Linux world is a pretty easy topic for me because I had a time when I was dealing with a lot of networking issues and dealing with a network architecture problem so in this section we going to see how we setup network communication on our Linux.
In the previous chapter we saw how to setup iSCSI, but as you know we need network card and set it correctly for having communication with the server (target), if we have some issue with that connectivity then the iSCSI never work until we solve that issue.
The first thing we can do when it come to networking, is to view our local eternet card and find what is our IP address, to do so we need to run ifconfig, with that command we can use to look our network card and even virtual like loopback.
 Figure 169-1 ifconfig command.
You can see that I have only lo that is my local loopback, but I know that I have also network card, so to view it also I can run the -a option, it will give me every network card that I have in that machine.
 Figure 169-2 ifconfig all devices.
You can see now that Ia have network device named enp0s3, in that device I haven’t associated IP address, so in that case I have note network connectivity for sure through that interface. Please be aware that if you can’t see some network card on the ifconfig command and the only way to view it is by -a option, this is mean that this interface is in down state, for bring it up we can use up by specifying the network interface.
 Figure 169-3 ifconfig bring the interface up devices.
You can see that I bring the interface up and after that it showed up on the ifconfig command, in case there is no IP associated with it even after we bring this interface up, we can not use ping or 8.8.8.8 as example, so what we can do is to setup the IP address manually or checking on our network why the DHCP dosn’t give us IP address.
You also can run the following command to check if you have IP address.
1
ip addr
As you can see on the following figure this command will give us information like what is the state of that interface and what is the IP address.
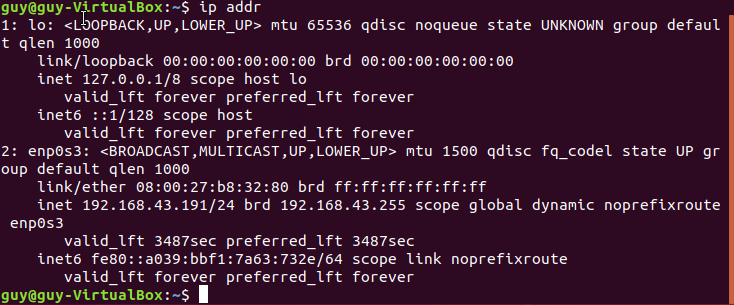 Figure 170 Checking the status on my interfaces.
If you need to setup IP address to that interface you can use ifconfig to achieve that.
1
sudo ifconfig eth0 192.168.0.1 netmask 255.255.255.0
Now after that interface is on up state and have an IP address we can trying to ping to google or other DNS server (that open to ping on the Internet), if it success we know for sure that our network work fine, if it doesn’t we may have another issue, so in that case we need to check what is our default getaway to the world wide network.
1
route
By using this command we will view the routes we have on our local machine, in my case I have not default getaway so we can use the following arp command
Please note: we can also use the ip neigh show which show the neighbors on the segment.
I guess that the default getaway is 172.16.3.254, so this is what I am going to setup on my route table.
1
sudo route add default gw 172.16.3.254 enp0s3
By running the route again we will can see that our new getaway in the table so now it the time to check connectivity to the network.
 Figure 172 Adding new route for default getaway.
I case we need to so the same on wireless card we can use ifconfig to bring the interface up and iwconfig to print the status of that interface.
 Figure 173 Setting of wireless interface.
As you may know our PC search for SSID to connect the network, we can print all the SSID we have on the room by running iwlist command.
1
iwlist wlp2s0 scan
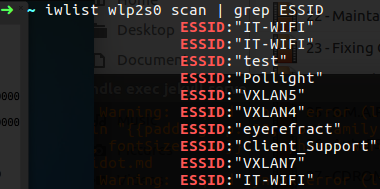 Figure 174 ESSID in my local area.
Please note: we can use the following command to view that capabilities of our wireless information, such as the frequencies, what are the Ciphers that being use and so on:
1
iw phy phy0 info
We can use the following to connect that network by using the ESSID we have now:
1
sudo iwconfig wlan0 essid IT-WIFI
If we haven’t IP address we can use DHCP for make query to DHCP server.
1
dhclient wlan0
We talk before about netstat and the following command is what I am love to use every time:
1
netstat -aenpl
This command give us information about the process number and the port related to it, in networking view we use most the following:
1
netstat -tuna
This will show us the local address and remote address, in case we have some network issue to some target we can check with netstat the state of that connection, if it say that this session is base on tcp and the connection is ESTABLISHED it is mean that all good!
The command ss is the same as netstat you can call it the new netstat, if you want to view the current listening socket you can use the -l option and the same in the netstat the option -t for tcp and -u for udp.
1
ss -tuna
By using that command we can know what port are open in my machine and in some cases that we have ESTABLISHED connection we will see the peer address with port that in use.
There is also the lsof command that we talk about in the lsof section, if you remember this command list open files on your system, but also can give us a clue about open session that we have, as example I have some establish connection that I can see if I run netstate or ss as follow:
 Figure 175 Network connection using netstat and ss.
In order to find what process I need to check that related to this kind of connection I need to know the PID that related to this session, but if I run the netstat -aenp
 Figure 176 Trying to check the PID of the ESTABLISHED session.
You can see that I have not PID for that establish session, what I can do is using lsof by grep the Inode number that I have from that establish session which is 64171.
You can see that the command for that session is anydesk so we know now that anydesk is using this session.
We can also run tcpdump to get more live information about this session, currently I am not using anydesk app so I don’t think we going to see many network packets that related to this session, but remember that this session is TCP based and also on ESTABLISHED state so surly we will see some packets.
You can see that I am using -XX option for HEX output and -vvv option for even more verbose output. So we have a little packets in that session but you can see that it is a live and working, also please note that the service that are being use is http of anydask, normally we can now what is the service by the port number, in my case it display as the service who use that port, but if we had port number 53 we know that this is DNS service of port 23 which is telnet, the server is always the side how specify that service port on the packet, so in my case the anydask is the server.
Please note: in the tcpdump we use the direction for monitor packets, we can use host as you can see in the figure 178, but also we can specify the source by src or destination by dst option in the command line.
For that section we need also to learn about nc which is netcat command that we can use to run remote executable commands or transfer files, and also get to know the nmap tools, you can read more about this two in my OSCP post but I also write little about them here.
The command for Netcat is nc and according to man page that tool is used for checking TCP/UDP port that are open or listen to them. This is mean that I am able to use it to connect to some email server with pop3 like I used in telnet before.
 Figure 179 POP3 used with telnet.
In my case the user and password are incorrect to this is why I have an error, but what I want to say is that with nc, if we want to open connection to some mail as we done with telnet, we can do the same.
 Figure 180 POP3 used with netcat.
The -n option means do not resolve the dns, and -v are verbose, if we want to listen to some port with nc, we just need to specify the -l option that stand for listen and -p for specific port, we can also used verbose to get more information about the session, the coolest thing is that we can used netcat for chatting over the network, on one machine we need accomplish that command:
1
nc -lvp 555
One the other station, we will need to use nc to connect to the first one PC, and that everything that we will type will showup on the other machine.
 Figure 181 Netcat with two station chat.
We also can use netcat to create connection between two PC’s and transfer file using that connection, for doing so we need to use redirection.
On the server side which is the listener, we use output redirect to redirect the incoming file to our local file location.
1
nc -vlp 555 >  file.txt
On the client side we open connection with netcat and use input redirection to redirect the file we want to transfer to our netcat command, in this action we establish communication which contain the file, after the transfer will finish we will be able to view the file on the server side.
1
nc -v 172.16.0.196 555 < file.txt
 Figure 182 Netcat transfer file.
Note: in my case I used netcat from my local linux to my local linux, but I encourage you to try it from one machine to another.
With nmap tool we can use to check what open ports we have on remote server, For example let’s say that in my local network I want to scan some remote machine for finding open ports’ I can just run the following:
1
nmap <ip address>
And it will bring me the information about that, so let’s look on it, right now I have an wireless card and I connect to IT-WIFI which is the ssid for the local wifi.
As you can see my IP address is 172.16.0.241, I can now run some arp to find some target that we can use for doing our scan.
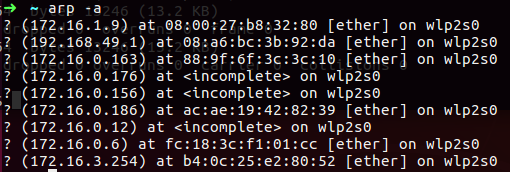 Figure 183 IP addresses in my network.
So now I can choose my target, please remember that this all are a live machine in my local network and to do scanning like what I am going to do in the public is in many cases illegal, in my case I am choose 172.16.1. address that look like nice address, so now I am running nmap, first we check if it a live by running ping to it.
 Figure 184 Open ports on the target.
You can see that on the target we have iSCSI service that run or at least port 3260/tcp which is use for iSCSI and more several ports open, so in case we trying for example to connect some website and the connection can’t establish we can check if we have open ports on that server, we may find other ports like 8080 open instead of 80.
Now I want to talk about troubleshooting,if we what to connect and use some service over the internet or even in our organization, we may have from time to time network issue that related to our local network area AKA LAN or issue in the wide area which is at our ISP side AKA WAN, in such cases we need to know how to troubleshoot and separate the issue and find in what area or level our problem begin.
Let’s say I have some PC that we need from that PC to connect the zwerd.com domain from our browser, but we have some issue to connect, and on the browser we get some error about connectivity issue.
 Figure 185 Can’t connect to this sites.
The first thing I automatically done is to ping that server and check if I have replay, in my case as you can see in the figure below it doesn’t work so we need to check our network.
 Figure 186 Trying to ping out.
In such case I will check first what is the status of my local network interface, you can see that if I run ifconfig I can see only the lo0, which is not the interface I expect see.
So what I need to do is to use option -a to see all of my interfaces, if it dosn’t show us another interface this is mean that maybe the drive dosn’t connect currectly or we have not driver for that adapter.
 Figure 188 ifconfig all interfaces.
You can see now the interface, so this is mean that this interface is on down state, you can also check it by using ip addr command.
Also by using ip addr command we can set up it’s ip address by specifying the IP address and the dev which is the interface like as follow:
1
ip addr add 192.168.0.1/24 dev eth0
In case you need to specify IPv6 for that interface by using the following:
1
ip -6 addr add new 2001:ad4::1223/64 dev eth0
You can see that the state for that interface (figure 189) is down, so for bring it up we need to run the following:
1
sudo ifconfig enp0s3 up
 Figure 190 ip addr interface up.
So now we can trying to ping to 8.8.8.8, but it also don’t work, so in that case we need to check the interface again and see if we have something missing.
 Figure 191 checking that interface.
You can see that I haven’t IP address on that interface, you can also see that I have not recieve any data on my RX although my TX send data, this is mmay mean that I have physical issue with my network, so I need to check it out.
 Figure 192 checking that interface.
So I found that I have some issue with my network card, and now it connect currently to my local switch, but still I have no IP address, so I need to check if I have some DHCP working in my network, if I haven’t I will need to setup the IP address manually.
 Figure 193 checking that interface.
So we can run the dhclient command to check if I get any IP address.
 Figure 194 checking that interface.
You can see that it work and now I have IP address, so now let’s trying to ping out. You can see that the ping is working fine.
So we can trying to using our browser to connect that site.
There is more thing we need to know that can help us in troubleshoot, one of them is traceroute this is really cool thing, this tool run pings over the network with TTL value of 1, this TTL is used to report the sender that the TTL value are 0, it meant to use for prevent eternal loop within the network, so we send out packet with TTL low number, when the packet forwarded the machine that done the forworking change the TTL value subtract it by 1, if the value is zero that machine inform the source that the “Time to live exceeded” and this is mean that one of the two thing, of we have a loop, or we need to increase the TTL value, in traceroute the value is increase when the source get the “Time to live exceeded” message, in that way we have the knowledge that the same machine who sent us the “Time to live exceeded” message is on of the hop up the path to our destination.
As example let’s run traceroute against zwerd.com
You can see the path, every hop replay to us with his IP address, so in that way we can know what is the path in layer 3 to our destination, there is also traceroute6 for IP version 6, and also we have tracepath for checking the mtu along the way, there is also the mtr which is a network diagnostic tool which can give you inforamtion about packets loss all over the path to destination.
To find our what is the hostname of our local system we can use hostname which is a part of severla tools as follow:
1
2
3
4
5
hostname - show or set the system's host name
domainname - show or set the system's NIS/YP domain name
ypdomainname - show or set the system's NIS/YP domain name
nisdomainname - show or set the system's NIS/YP domain name
dnsdomainname - show the system's DNS domain name
Hostname is used to display the system’s DNS name, and to display or set its hostname or NIS domain name, normally by reading the contents of a file which contains the host name, e.g. /etc/hostname.
You can also use the /etc/resolv.conf file which contain a list nameservers that are used by your host or DNS resolution. if we are using DHCP this file is automatically populated with DNS recode issued by DHCP server.
Please note: if none of dns server specify on that resolv.conf file you can check on nslookup, every query need to specify the DNS IP address, if it dosn’t or it specify 172.0.1.1 which is local loopback, ensure that the dns service are list in /etc/nsswitch.conf, you also can run the following command to get that information:
1
nmcli dev show | grep DNS
There is also the /etc/hosts file which also contain hostnames and IP address, this file contain static table lookup for hostnames, this is mean that we can use if in case we have no DNS server configure for our host, or we want to specify specific record for some host or block the local machine to successfully resolve the IP address for some host.
Please note: if users complain about slowness that related to the network like let’s say the browser bring up sites slow, so you checked the network and bandwidth and it’s look working good, in that case you may want to check how much time does it take to resolve DNS query, you can do so with the dig or time command as example time nslookup zwerd.com.
We can also apply sort of access list that contain the allow connection host on the network to connect our local machine by specify their name and address in the /etc/hosts.allow, in that way we can done what we would done with FW, but this time this policy apply on our local machine. We can also do the same to deny hosts from enable their connection to our local machine by specify them in the /etc/hosts.deny, this technology is called TCP Wrapper which is an open source host-based ACL (Access Control List) system.
Please note: in that files we specify the information as follow:
1
2
3
tftpd : 192.168.1.0/255.255.255.0
telnetd : 10.2.4.
httpd : ALL EXCEPT 172.16.
I the first line we specified the all class C of 192.168.1.0 network, we also allow all telnetd from 10.2.4. which actually class B also, and we specify httpd connection from all hosts except 172.16.0.0.
If we suspect that we had some issue regarding to our network drive and have no IP address or some missing setting on our local machine, we can run dmesg tool to find some logs that was created during the bootup, as example in my case let’s say that I suspect that I have some issue related to my wifi card, so I can grep our all of the logs that have the wlp2s0 string which is my wifi interface.
 Figure 198 My wifi interface logs from dmesg.
We can find more related logs in the /var/log/syslog file that contain more details about my wlp2s0 which is my wifi interface.
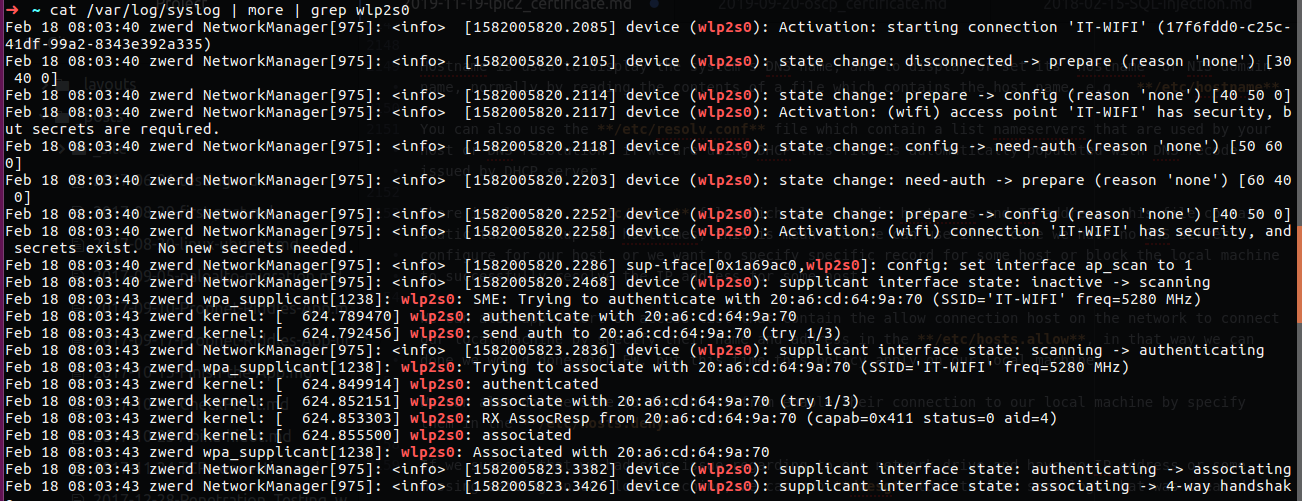 Figure 197 My local syslog grep wifi.
Challenge 205-1
- Donwload TinyCore and run it as command line mode.
- Setup new virtual interface.
- Try to run ping from you local computer to the TinyCore virtual interface.
- If it doesn’t work, try to solve it.
1. Download and run TinyCore.
The TinyCore is minimal linux that can run live, we can use that for this task, you can find the iso image on the following link from the TinyCore site.
After we have the iso file we can run it on virtual box and bring up the cli.
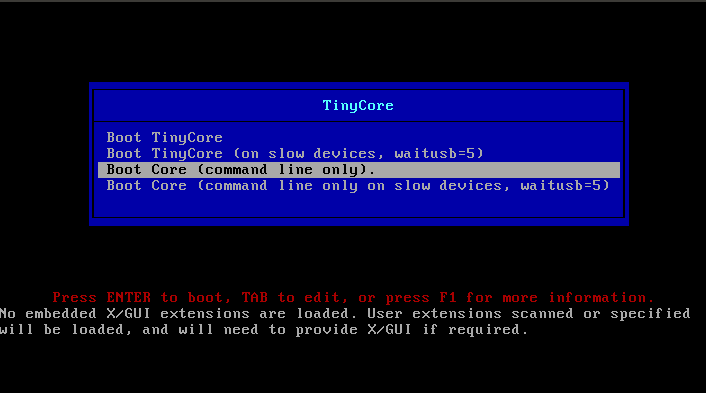 Figure 198-1 My TinyCore boot menu.
You can see that we have the option for cli mode which is what we need to use.
2. Bring up virtual interface.
The virtual interface is mostly lo so we need to create one more lo which is going to be number as what we specified, so we need to run the following command for that task:
1
ifconfig lo:1 10.1.1.1 netmask 255.255.255.0
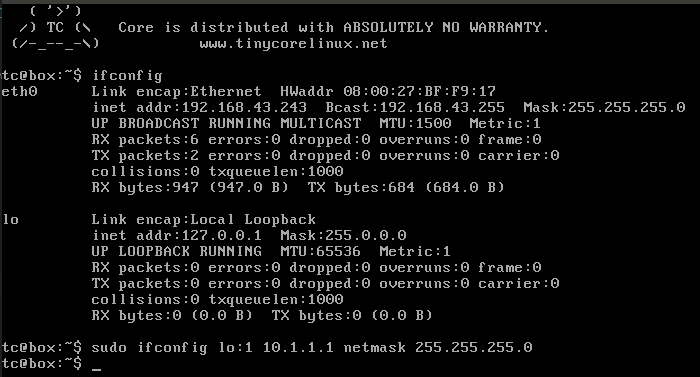 Figure 198-2 My loopback interface.
You can see that I use sudo, you should do the same, after that you need to check if that interface is up and runing, we can type ifconfig again and also use ping to check that you have local answer.
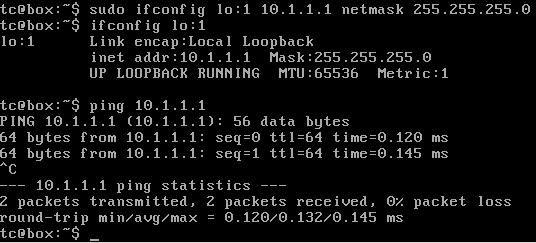 Figure 198-3 The interface is up and running.
3. ping from my local machine.
So on my ubuntu I run the followin:
1
ping 10.1.1.1
But guess what, it failed….
This is append because we have no route to tell us what is the next step for the virtual machine, on the virtual machine I setup the interface to be brig so it should be in my network.
4. Trying to solve the network issue.
So we have network issue, in the real world if you try to use some service like ssh to some server and this is not working you can run ping for checking communication to the server, if the ping is not working we have some networking issue that need to be solve before we can get to that server.
In my case I have no ping to the TinyCore machine so I need to check what is the IP address of that machine, and if you remember on Figure 198-2 we saw that the address for wth0 is 192.168.43.243, so I know that this machine is locate at the same subnet my local machine, so what I can do is run ARP to see if I have the MAC address for that machine.
Please remember that you can also use ip neigh to see the neighbors on the same local network. You can also see that MAC address for TinyCore machine is 08:00:27:bf:f9:17, so we can trying to ping that and is should work.
 Figure 198-6 My ping is working.
So now we know for sure that we have network connection to the virtual machine, but we have no right connection to the loopback interface on the virtual machine, so we need to check on our routing table if our local machine knows how to get there.
You can see that I have no route to this 10.1.1.0 network so this is why the connection or ping dosnt work for that network, what I need to do is to add that route to my routing table.
 Figure 198-7 Adding more route to the table.
tou can see that I specify how to get the 10.1.1.0 network, this is the interface eth0 of the TinyCore machine, I use the route command to check if that route is on my routing table, also we can run ip route that bring us more details about the route, like who is the DG for that route which is in my case 192.168.43.243.
So now it’s time to ping again to the loopback of the virtual machine and check if its working right.
 Figure 198-7 We have network connectivity.
So it working! we finish the challenge!
Chapter 6
Topic 206: System Maintenance.
Now I want to tell you a story that happened to me in the last year, if you follow my posts you can see that already 8 years ago I was talking about OSCP certification, last year I met a friend who knew me for a small group that opened for one purpose - Bug Bounty. For those who don’t know, Bug Bounty is a program that allows us to hack software from reputable companies and earn money! Yes Yes! Money on hacking into software.
That evening as the group got into acquaintance, each one talked about himself, one of the members said that in his company some day had exploited some weakness and was able to apply bitminer to one of the servers in the organization he was working on, he surpassed it with all kinds of tools that slowly identified the server to other servers.
I knew the bitcoin issue already, but I did not know what actually made bitminer and how it uses resources to perform other process calculations.
Why am I talking about that? Because in this chapter we have to compile our own software, it’s similar to what we did with the kernel in the second chapter, but here is more about a binary program when the compiler is supposed to prepare it for execution, and guess what software we’re going to compile?
exactly!
We’re going to compile the bitminer and prepare the binary for execution, I’m sure it will be interesting.
So first of all we download the tar file from the following link pooler-cpuminer-2.5.0-linux-x86.tar.gz
after that run the following:
1
tar -zxvf pooler-cpuminer-2.5.0-linux-x86.tar.gz
 Figure 199-1 Extract the file using tar.
After that we will have new folder that contain many files.
What we need to search now is the configure file and run it as ./configure, while it run you can see what is does, if some error appears we will need to fix if before we can compile this binary.
You can see that have missing program named libcurl, so I can run apt-cache search libcurl or search it over the net.
 Figure 201 Search for that program.
You can see that I had many program to choose, as much as I know from Shawn Powers every package that contain the name dev, it’s mean that this is actually develop packege that can allow us to compile source code, so in my case I am going to install libcurl4-openssl-dev.
 Figure 202 Finish succesfully.
Now you can see that it end up without an error, so we can start to make the binary file
 Figure 203 Search for that program.
Now if I run that minerd file you can see that I have an output, but as you may notice I am using that as a local directory with ./minerd, for making it acually binary tool that can run without the need to run it from the source folder we just need to run.
So what we need to do is to run sudo make install, this command will put it in /usr/local/bin, so now we can run it from any directory location in our machine.
Please remember that by default all source code are store and can be found in the following directory
1
/usr/src
In case we have a program that already install on our system we may want to apply a patch for that program, to do so we can run the patch command with that program patch file.
The patch file is file that contain the differences between the old file and the new one, this will update our program by applying it.
so if we have old program and we create a new one we can run the following:
1
diff -u oldprogram.c newprogram.c > program.patch
For applying this patch just run.
1
patch < program.patch
Please note: you can use the -p option and specify the number of path it will strip off
I want to talk about tar and rsync right now, with these two tools we can use to back up some important folders that back them up:
1
2
3
4
/etc/
/var/spool/
/home/
/usr/local
In some folders we can find important things like system settings or binaries or logs, it really depends on what we need, these are the folders we might back up
1
2
3
/var/lib/
/var/log/
/opt/
True, we talked about a RAID that provides a type of backup, but in truth it is more at the level of being able to use information that a disk has even though one disk is damaged or destroyed, when talking about this backup goes well beyond the RAID, it is actually our way of taking the files and replicating them to another location or To a completely different server, in this way we ensure that the files remain accessible even if the computer is damaged and unable to work.
The first thing we can do is use tar to prepare a tar file that compiles all files separately from our folders
1
tar -cvf backup.tar /Documents
This command will create an archive file that will contain all the files specified in my case, in the case of the Documents folder.
There is a much better way to do a backup and it is through rsync, this tool actually creates a backup folder and also tracks changes made to files, if changes are made it will update them in the backup folder, although if we created a new file we will need to run the command again so that it backs up the extra file
1
rsync -av Documents/ backupfolder
We can also use the rsync to make backup over the network by using ssh as follow:
1
rsync -av Documents guy@172.16.1.9:/home/guy/
This will make backup on other server so if we make change of some file that in the Documents folder it will update the backup on the server.
For backup there is another solutions that can help us, one of them is Amanda previously known as Advanced Maryland Automatic Network Disk Archiver is an open source computer archiving tool that is able to back up data residing on multiple computers on a network. It uses a client–server model, where the server contacts each client to perform a backup at a scheduled time.
You can install that step by step by watching that videro, there is more solution for backup like Bacula, Bareos and BackupPC, all are the same consept.
For the exam we need to know mt tool, as much as I understand this tool is used for tape drive which is magnetic plastic strip that use for backup.
The default drive for tape is /dev/st0 , so we can use tar for backup what we need, just run on this tape as follow:
1
tar -czf /dev/st0 /www /home
In that case I backup the www directory and also the home directory to my tape which is the st0 drive. We can rewind that tape by using the following command:
1
mt -f /dev/st0 rewind
Only after that we will able to use tar to backup our directories. For checking that tape status simply run the following:
1
mt -f /dev/st0 status
We can also erase the tape by adding the erase option to this command.
We can also use dd command for backup the whole disk, just look on the following command:
1
sudo dd if=/dev/sdb of=/dev/sdc bs=64k conv=noerror,sync status=progress
That command run over sdb drive and copy all to sdc drive, the option bs stand for 64k which is more useful then the default 512 byte, conv set on noerro which mean to ignoring all read error, the sync used for fill input blocks with zero if there ware any read errors and the status option set on progress for us to be able to see the running state of dd because such command may take a long time to run.
In the lest part of this chapter we need to talk about notify users on system related issue, which mean that if we have some error and we want to fix it, and the only way to fix it is to do something to the system that can make angry some of our users, like shutdown or kill some app, we can notify the users by several ways.
The first way to do so is to write message on the shell which every user that connect to this server over the command line will get notify about that message:
1
wall < message.txt
In this command I run the wall command and apply it the text file which contain my message, this will broadcast that message to every user that connect to this server over the shell.
 Figure 207 Message by wall command.
You can see the message on the screen of that user that came from guy, and time and date also specify. If you dont have text file ready for broadcast message, you can just run the following on the command line and it work the same.
1
ehco "hello, this system is going down in 5 minits!" | wall
We also have the Message Of The Day which is /etc/motd file that can contain any message you want, after user connect to our server via ssh he will get this message immediately.
What we need to do to make it work is to change some line in the ssh configuration file in the /etc/ssh/sshd_config.
After that if user connect in he will get this message print on the screen. In case we want to print on the user screen message before he login, we can use /etc/issue.net, we also need to update the sshd_config file and restart the service.
 Figure 209 The net issue file.
And we inform our user if we want to run on shotdown or systemctl poweroff.
Let’s look on the centOS, I remotly connected to it from my Ubuntu by using ssh, on my centOS I run the following:
1
shutdown 2 the system is going shutdown!
 Figure 210 CentOS shutdown command.
On my Ubuntu I can see the following massage:
 Figure 211 CentOS shutdown report.
Challenge 206-1
You are working as system administrator in company X, and some of their user contact you and say that he need backup for his documents which contain some classified data, he also told you that he make changes on the documentation folder which must be backup for every day and he need that every day new archive need to be created that backup all the file on the Documentation folder, you also need to backup the archive to other server.
- Create cone job that going to be run every day and create archive folder.
- Backup the archive on other server by using rsync, this also need to be run using cron.
- When the job is done popup some message for that cleant to inform that the backup was completed.
If I remember right the cron was part of the materials for the LPIC1 exam so this is knowledge that we must be well strong base, about the popup message we saw so far that we can use wall, in that case we need to inform about backup completed to the user interface.
1. Create cron job for archive the Document folder.
In my case like every challenge in that post I am using centOS as my server and Ubuntu as client, I am going to create the cron job on the client but please remember that it the real world you need to do that on the server which mean that if you going to using some script it can be run on the user side because in that way you can not menage those files scripts.
To create new cron job we need to edit the crontab cy using the crontab -e command, this command will bring up the crontab file which going to use and specified the task job we need to run.
You can see that I add to this file the job for run every day as 6:00 AM, the first 0 stand for minutes and the 6 stand for hour, the followup asterisks are for day of month, month number and day of week that can be 0-7, in my case I didnt specify any of those so this is mean that I am going to run this job every day ar 6 AM.
Now if we want to check the logs that related to the cron job we can use the /var/log/syslog and search for every line that realated to CRON:
 Figure 212-2 My syslog about CRON.
You can see that I grep out the CRON and this give me line that related to some jobs that was run, now I need to create the script backupfiles.sh, in this script we going to archive the Documents folder and specified the new file with the name of the correct day.
1
2
3
#! /bin/bash
cd /home/zwerd/backups
tar -zcvf "documents_backup_$(date '+%Y-%m-%d').tar.gz" /home/zwerd/Documents
You can see that I specified the date as numbers in the name of the backup file, this can help us to do what is the date of that backup.
2. Add rsync to cron script for backup the file to other server.
So now we need to backup all to other server which again in my case it’s CentOS, in that server I have folder named /mnt/share/backup and this is what I going to use, I also need to bring up the sshd service by typing service sshd start for using rsync backuping to my CentOS.
Now I need to add the following line to my script:
1
2
3
4
#! /bin/bash
cd /home/zwerd/backups
tar -zcvf "documents_backup_$(date '+%Y-%m-%d').tar.gz" /home/zwerd/Documents
rsync -av ./ root@192.168.43.107:/mnt/share/backup
This line will cause backup all the correct folder to the remote server, we can test it without the cron job to see that it working.
3. After the backup is finish alart it to the UI and CLI.
For doing just that we need to add to out script more line, the first one going to be echo message by using wall to inform the user via CLI that the backup was done.
1
echo "Done Backup the document folder, you can find the last backup on the server /mnt/share/backup" | wall
Now I need to bring message to the UI so I using zenity and give it parameters for my message:
1
zenity --info --text="Your backup is ready\!" --title="Documents Backup"
So, the cron job need to look like as follow:
1
2
3
4
5
6
#! /bin/bash
cd /home/zwerd/backups
tar -zcvf "documents_backup_$(date '+%Y-%m-%d').tar.gz" /home/zwerd/Documents
rsync -av ./ root@192.168.43.107:/mnt/share/backup
echo "Done Backup the document folder, you can find the last backup on the server /mnt/share/backup" | wall
zenity --info --text="Your backup is ready\!" --title="Documents Backup"
And this is it, we finish the challenge!
For the end of that post I’d like to finish with another video of Linux foundation.
Please remember that Linux if every where, so learn it and support it can be great thing for you.
Cheers.
Guy.
